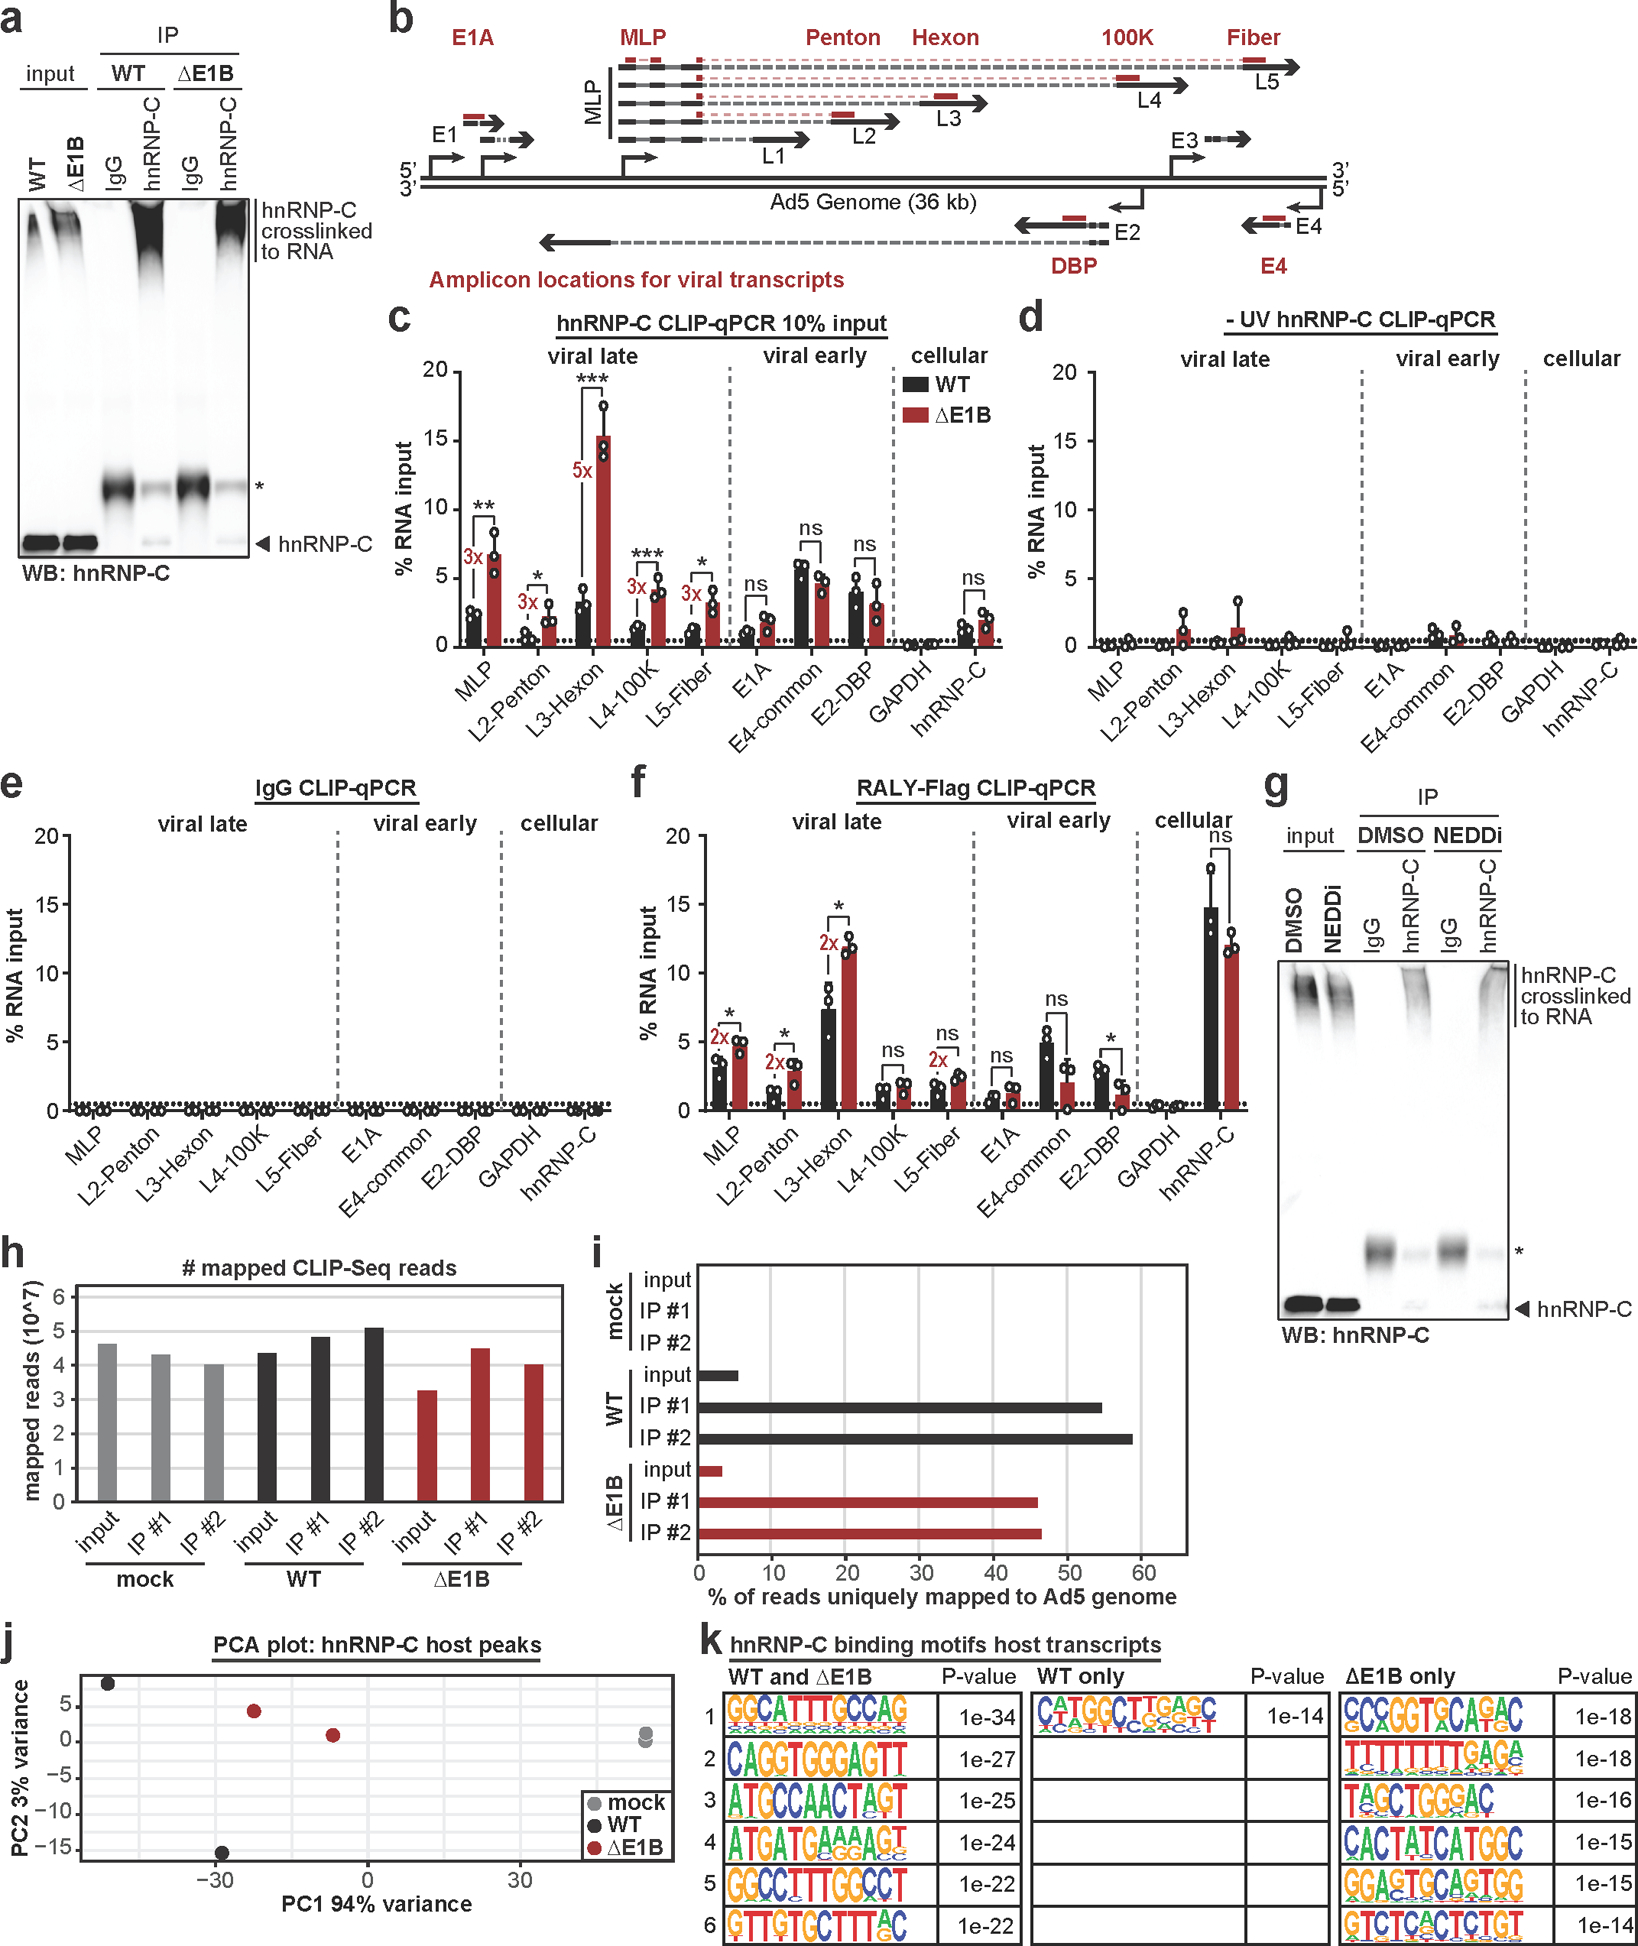
Extended Data Fig. 9. In the absence of E1B55K, hnRNP-C and RALY interact more with viral late RNA.

a, Control immunoblot for hnRNP-C CLIP-qPCR in Figure 5b. Higher molecular weight complexes represent hnRNP-C crosslinked to RNA. * indicates antibody heavy chain. b, Schematic of Ad5 genome and viral transcription units. Amplicons for early (E1A, DBP, E4) and late (MLP, Penton, Hexon, 100K, Fiber) transcription units indicated. c, HeLa cells infected with WT Ad5 or ΔE1B (MOI=10), UV-crosslinked and harvested at 24 hpi, subjected to hnRNP-C CLIP with 10% input as compared to Figure 5b and RT-qPCR of indicated transcripts. d, HeLa cells infected with WT Ad5 or ΔE1B (MOI=10), without UV-crosslinking, and harvested at 24 hpi, subjected to hnRNP-C CLIP and RT-qPCR of indicated transcripts. e, HeLa cells infected with WT Ad5 or ΔE1B (MOI=10), UV-crosslinked and harvested at 24 hpi, subjected to IgG CLIP and RT-qPCR of indicated transcripts. f, HeLa cells induced for RALY-Flag expression with doxycycline for 3 days total, infected with WT Ad5 or ΔE1B (MOI=10), UV-crosslinked and harvested at 24 hpi, subjected to Flag CLIP and RT-qPCR of indicated transcripts. For all CLIP-qPCR experiments: GAPDH = negative control, hnRNP-C = positive control. g, Immunoblot for hnRNP-C CLIP-qPCR in Figure 5c. Higher molecular weight complexes represent hnRNP-C crosslinked to RNA. * indicates antibody heavy chain. h, Number of mapped hnRNP-C eCLIP-Seq reads for the indicated conditions. i, Percentage of mapped reads that uniquely mapped to Ad5 genome for different hnRNP-C eCLIP-Seq conditions. j, PCA plot for hnRNP-C peaks mapped to host transcripts comparing mock (grey), Ad5 WT (black), and Ad5 ΔE1B (red). k, Top 6 hnRNP-C binding motifs in WT and ΔE1B infection, WT infection only, and ΔE1B infection only. n=1043, 162 peaks, and 267 peaks, respectively. Enriched motifs were identified with HOMER Software Package using hypergeometric enrichment calculations and adjustments for multiple comparisons. All data are representative of two (h-k) or three (a-g) independent experiments. Graphs in c-f show mean+SD. Statistical significance was calculated using unpaired, two-tailed Student’s t-test, * p <0.05, ** p <0.01, *** p <0.005.
