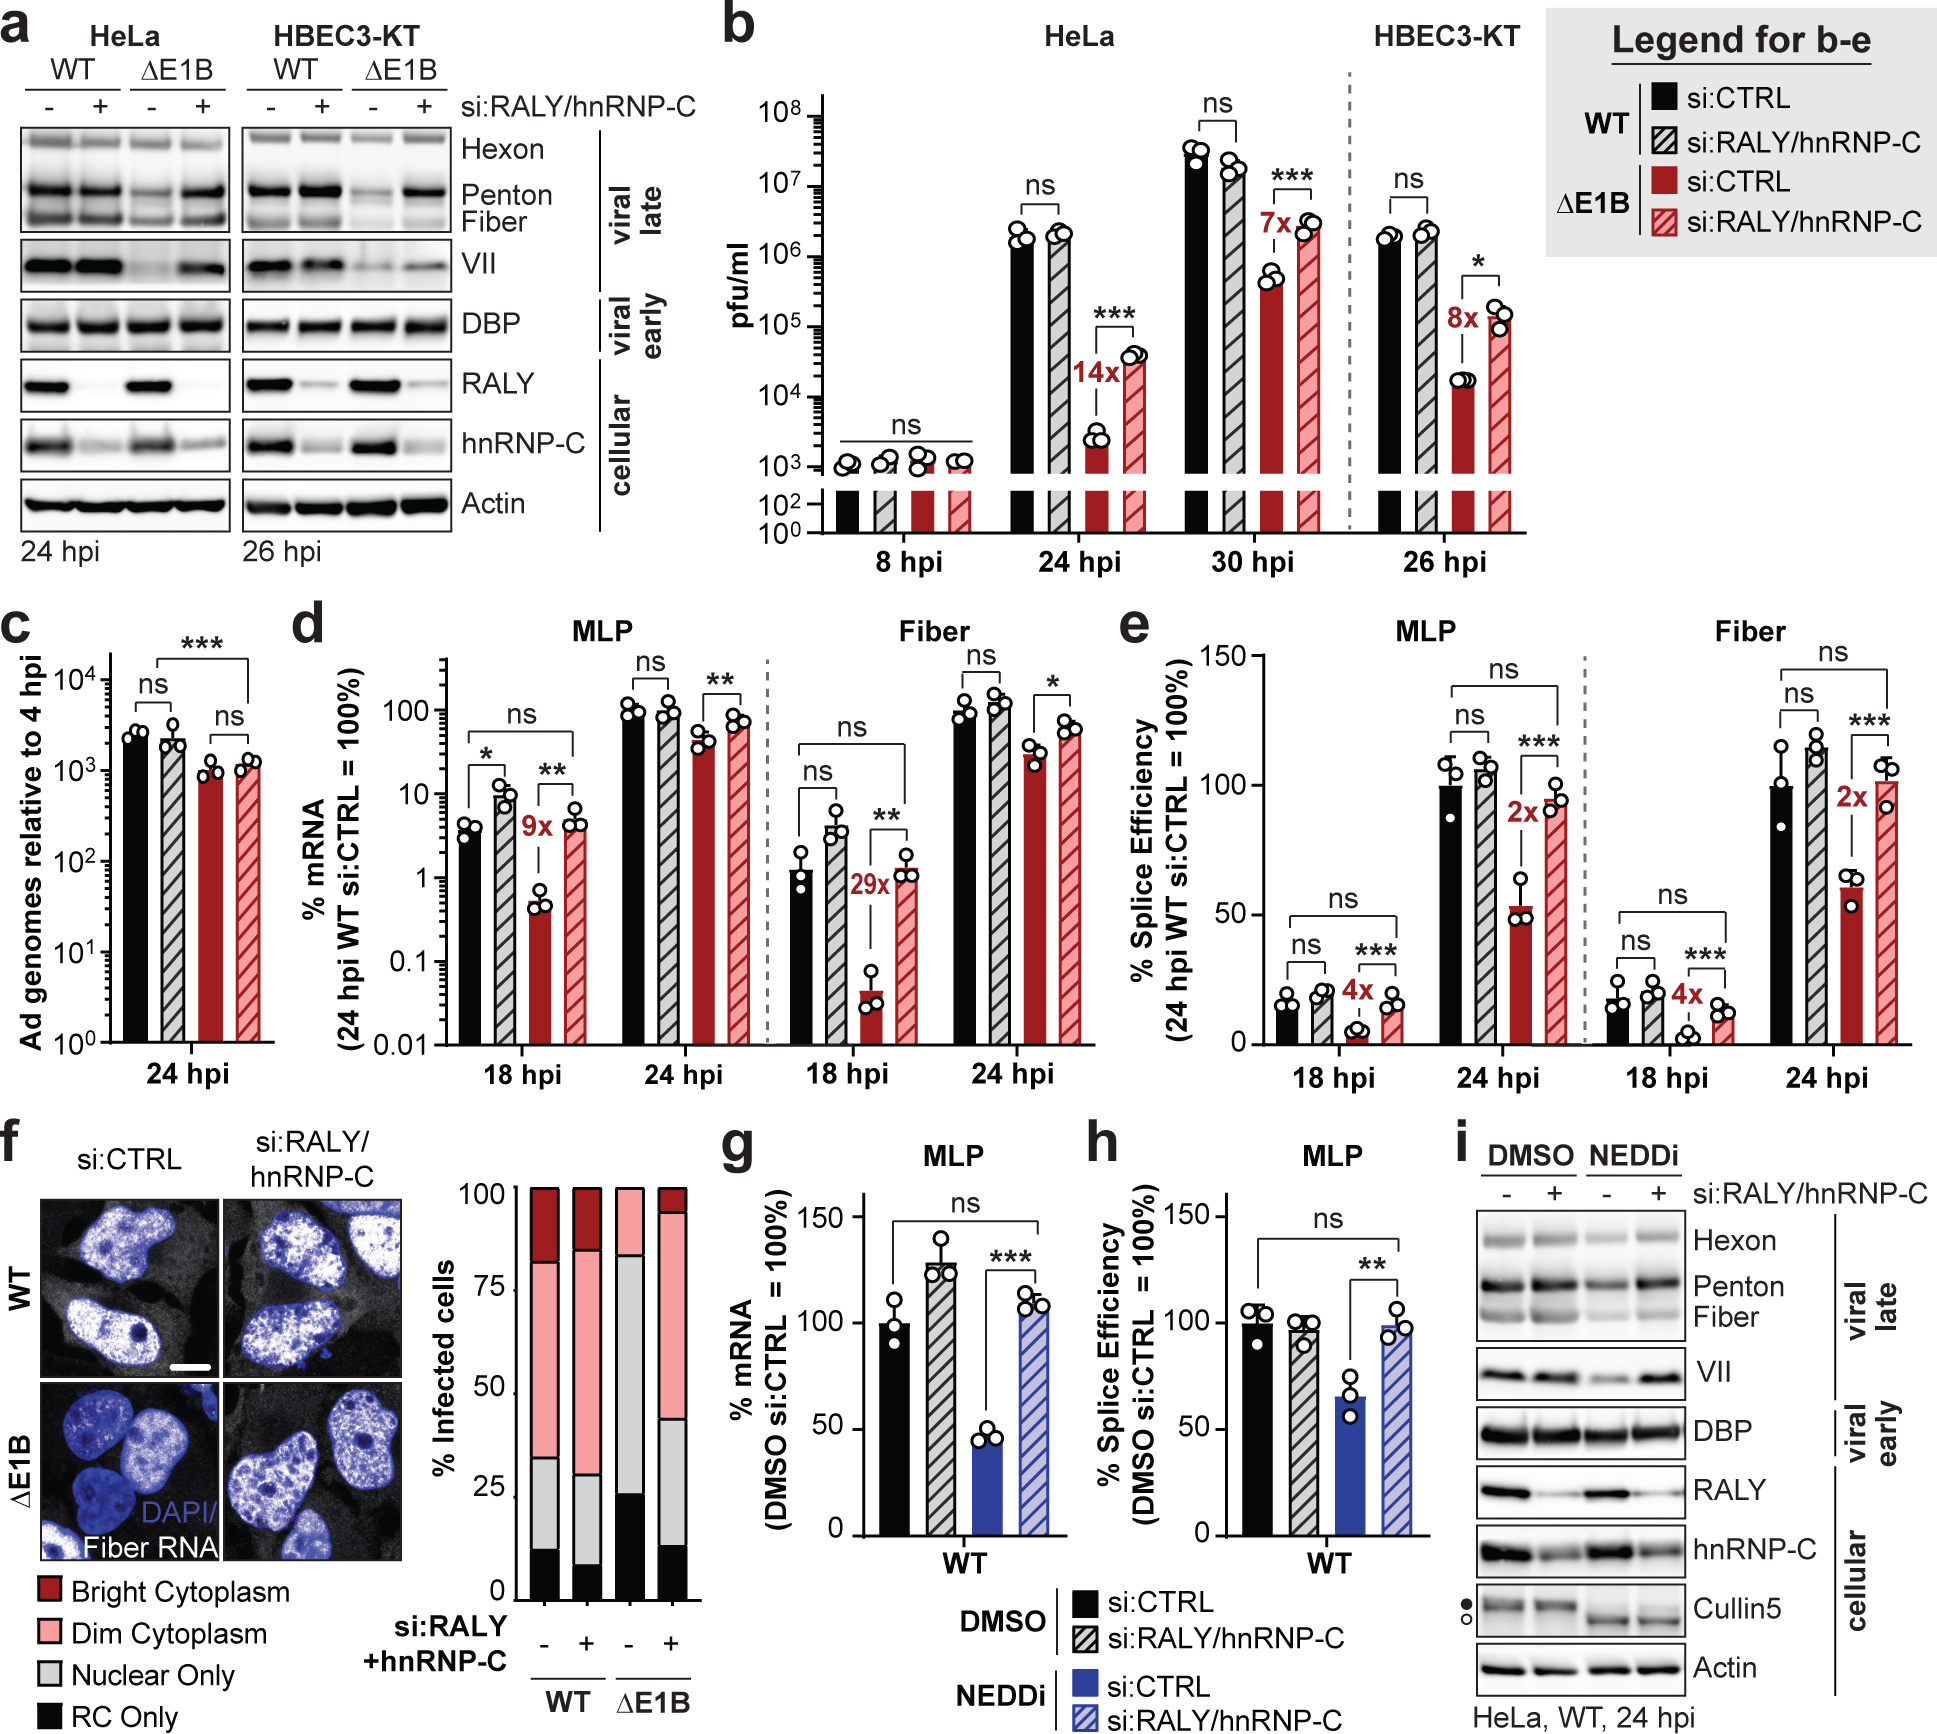
Figure 4 |. Knockdown of RALY and hnRNP-C rescues the RNA processing defect caused by absence of a functional E1B55K/E4orf6 complex.

a-f, HeLa cells or HBEC3-KT (only a,b) transfected with control (si:CTRL) or RALY and hnRNP-C (si:RALY/hnRNP-C) siRNA 24 h prior to infection with Ad5 WT or ΔE1B (MOI 10), harvested at respective time points. a, Immunoblot analysis of viral and cellular protein levels. b, Bar graph representing plaque assays for viral progeny. pfu=plaque forming units. c, Bar graph representing qPCR of viral genomes normalized to input. d, Bar graph representing spliced RNA levels of viral late transcripts MLP and fiber measured by RT-qPCR. e, Bar graph representing splicing efficiency (ratio of spliced to unspliced transcripts) of MLP and fiber measured by RT-qPCR. f, Representative RNA FISH visualizing localization of fiber transcripts (white) in relation to nuclear DNA stained with DAPI (blue) and quantification of observed pattern for >100 HeLa cells. RC=replication center. Scale bar=10 μm. g-i. HeLa cells transfected with control (si:CTRL) or RALY and hnRNP-C (si:RALY/hnRNP-C) siRNA for 24 h prior to infection with Ad5 WT (MOI=10), treated with either DMSO or NEDDi at 8 hpi and processed at 24 hpi. g, Bar graph representing spliced RNA levels of MLP measured by RT-qPCR. h, Bar graph representing splicing efficiency of MLP measured by RT-qPCR. i, Immunoblot analysis of viral and cellular protein levels, with neddylated (●) and unmodified (○) forms of Cullin5 indicated. All data are representative of two (f) or three (others) independent experiments. All graphs show mean+SD. Statistical significance was calculated using an unpaired, two-tailed Student’s t-test, * p <005, ** p <0.01, *** p <0.005.
