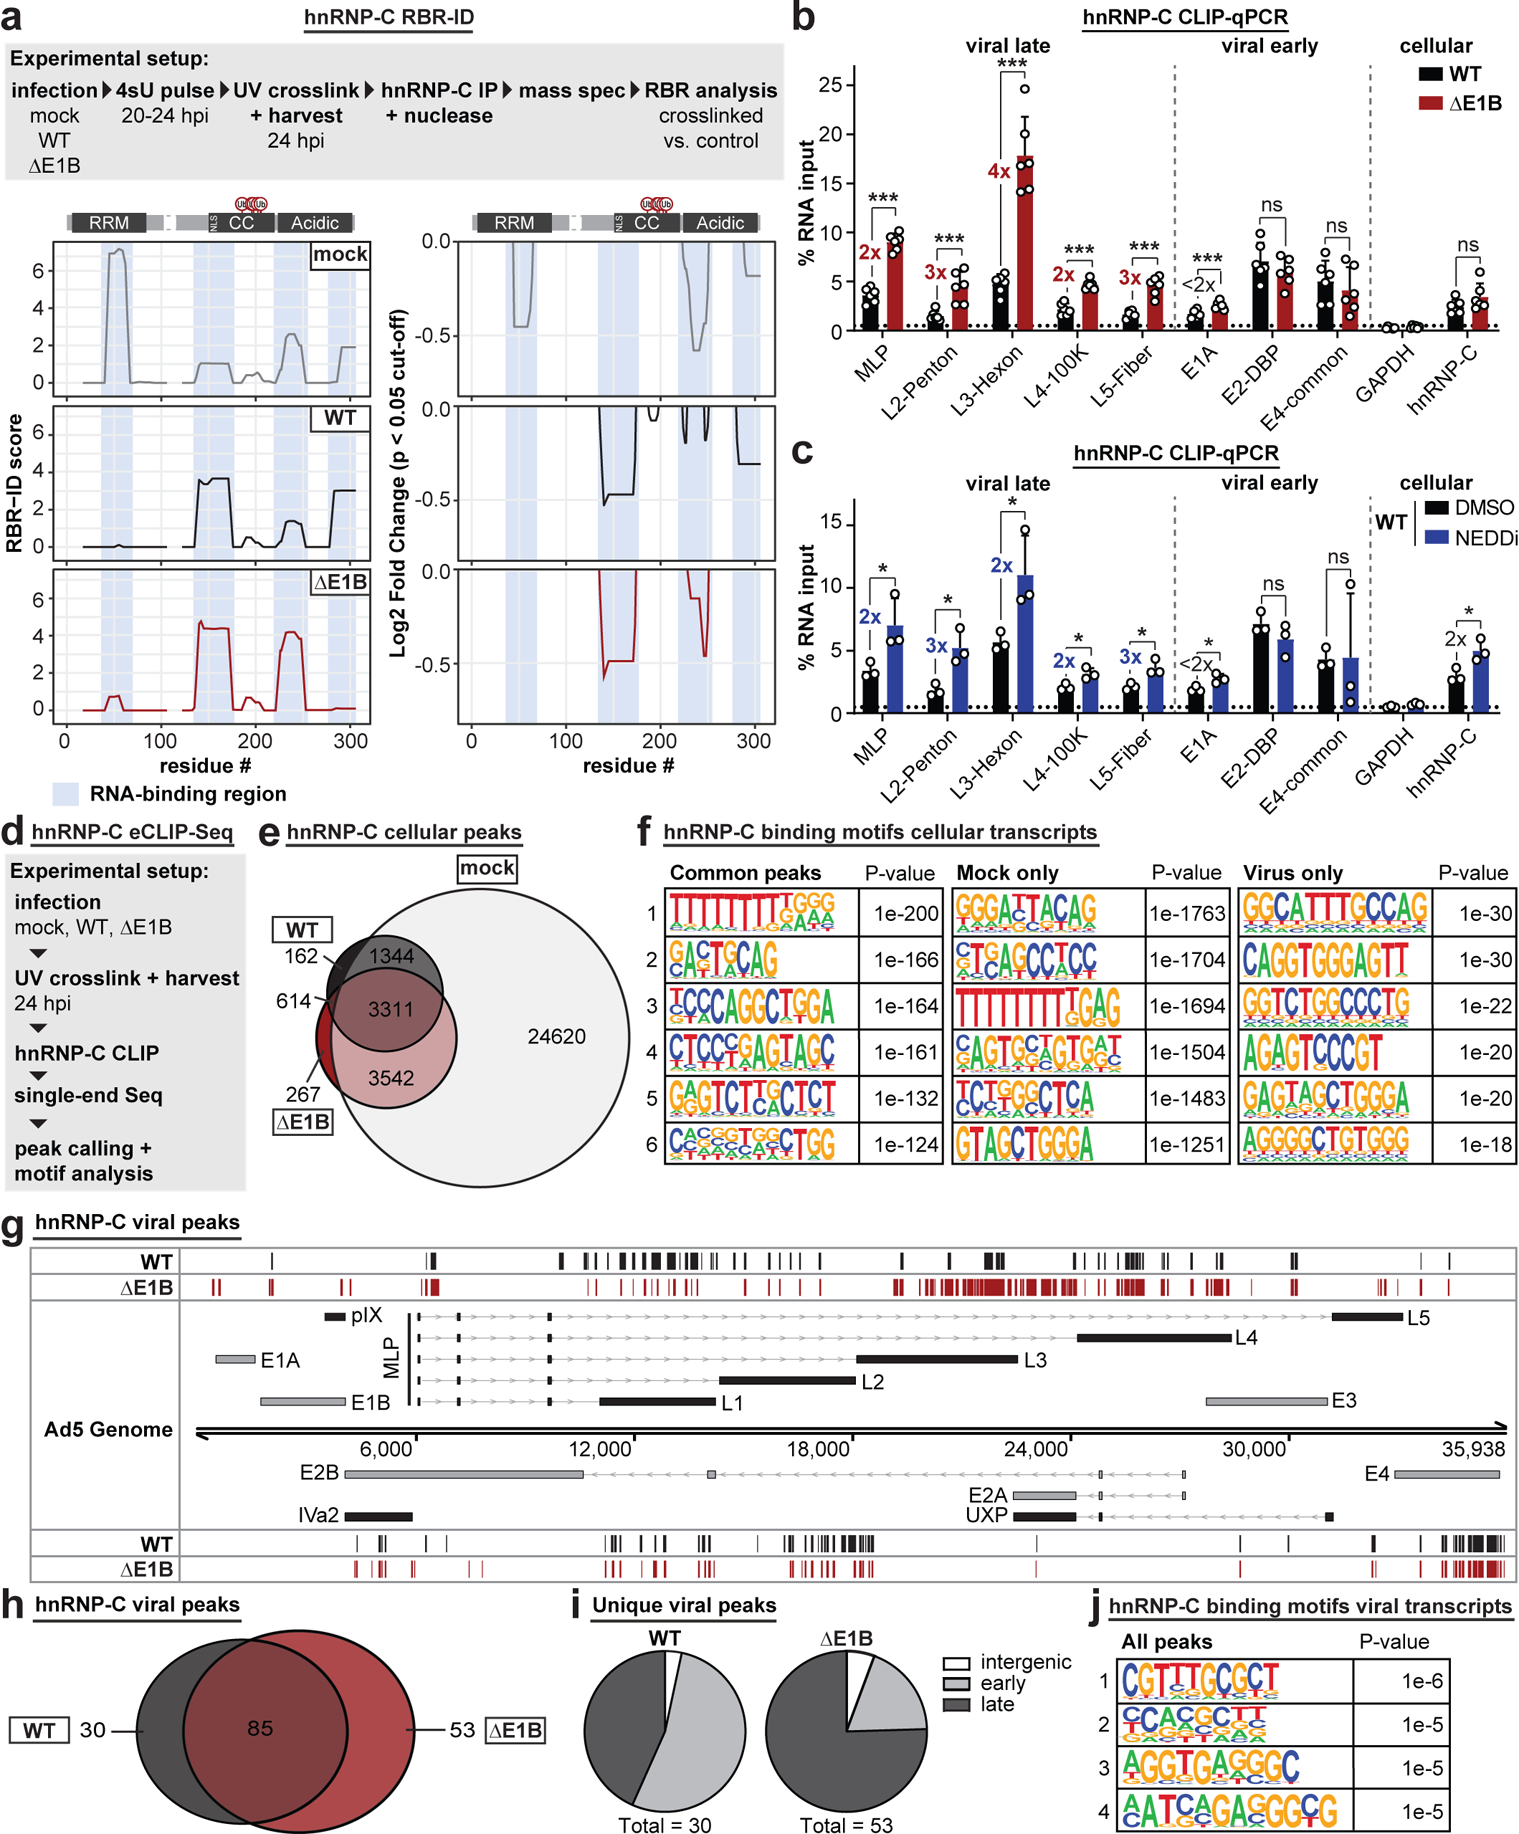
Figure 5 |. Interaction of hnRNP-C with viral late RNA increases in the absence of functional E1B55K/E4orf6 complex.

a, RBR-ID (RNA-binding region identification) for hnRNP-C comparing mock (grey), Ad5 WT (black), and ΔE1B (red) conditions at 24 hpi (MOI=10). Experimental setup (above), smoothed residue-level RBR-ID score plotted along primary sequence (left), and smoothed residue-level fold-change of crosslinked/control conditions with significance threshold p < 0.05 (right). hnRNP-C domain structure with ubiquitination sites shown above graphs. RNA-binding regions shaded in blue. n=3 biologically independent experiments. b-c, Bar graphs showing results of hnRNP-C CLIP (cross-linking immunoprecipitation) and RT-qPCR for viral transcripts. GAPDH: negative control. hnRNP-C: positive control. Graphs show mean+SD, n=6 (b) or 3 (c) biologically independent experiments. Statistical significance was calculated using an unpaired, two-tailed Student’s t-test, * p <0.05, ** p <0.01, *** p <0.005. b, HeLa cells infected with WT Ad5 or ΔE1B (MOI=10), UV-crosslinked, and harvested at 24 hpi. c, HeLa cells infected with WT Ad5 (MOI=10), treated with DMSO or NEDDi at 8 hpi, UV-crosslinked, and harvested at 24 hpi. d, Experimental setup for hnRNP-C eCLIP-Seq. e, Venn diagram for hnRNP-C peaks in host transcripts for mock (grey), Ad5 WT (black), and ΔE1B (red). f, Top six motifs for hnRNP-C binding sites in host transcripts in all 3 conditions (left), mock only (middle), or virus only (right, WT only + ΔE1B only + WT and ΔE1B). n=3,311, 24,620, and 614 peaks, respectively. g, hnRNP-C peaks in Ad transcripts for Ad5 WT (black) and ΔE1B (red). Simplified schematic of the Ad transcriptome with forward-facing (above) genome and reverse-facing (below) transcription units. Shown are exons (bars) and introns (lines with arrowheads) of early (grey) and late (black) viral genes. h, Venn diagram of hnRNP-C peaks called in viral transcripts for Ad5 WT (black) and ΔE1B (red). i, Pie charts of unique peaks for WT and ΔE1B showing the location in intergenic, early, or late transcription units. j, Top four motifs for hnRNP-C binding sites in viral transcripts for all conditions. n=168 peaks. Enriched motifs in f and j were identified with HOMER Software Package using hypergeometric enrichment calculations and adjustments for multiple comparisons. Data from e-j are representative of two biologically independent experiments.
