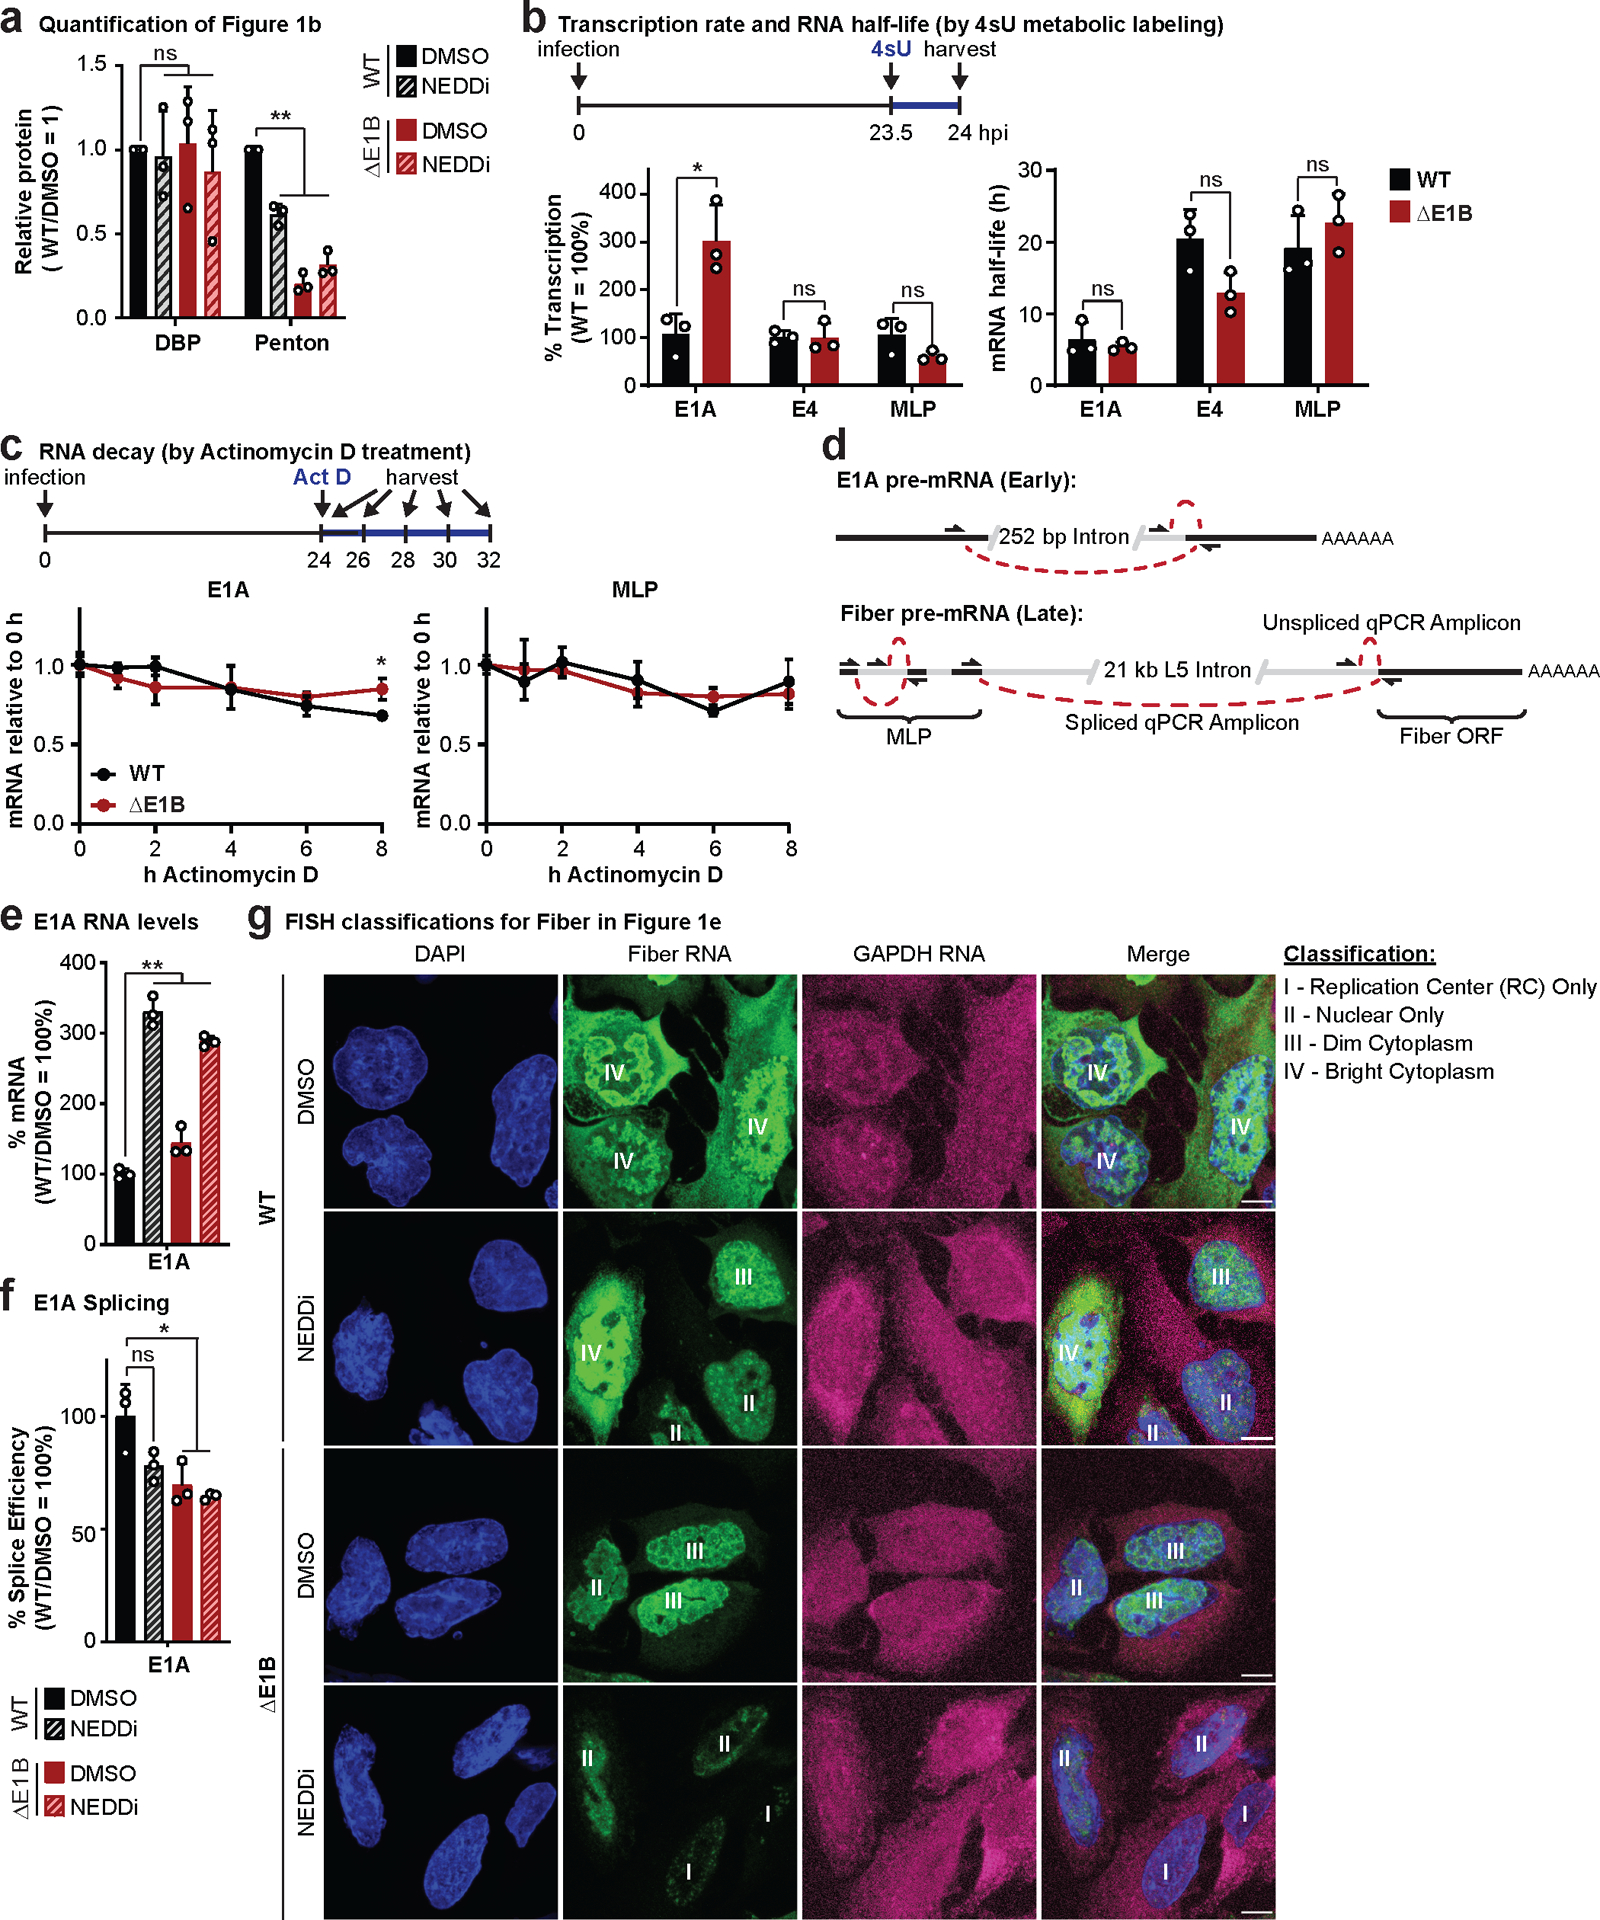
Extended Data Fig. 1. E1B55K deletion or inhibition of Cullin-mediated ubiquitination does not decrease late RNA transcription, decay, or early RNA processing.

a, Quantification of results shown in Figure 1b. b, Analysis of nascent transcription and mRNA half-life by labeling RNA with 4-thiouridine (4sU) for 30 min at 23.5 hpi in HeLa cells infected with WT or ΔE1B Ad5 at MOI=10. Nascent 4sU-labeled RNA was purified for RT-qPCR to determine relative transcription rates of two early (E1A and E4) and one late (MLP) viral transcripts. mRNA half-life was approximated using the ratio of nascent and total input RNA levels normalized to GAPDH. c, Analysis of decay of viral early (E1A) and late (MLP) RNA species by Actinomycin D pulse at 24 hpi in HeLa cells infected with WT or ΔE1B Ad5 at MOI 10 by normalization to input levels. d, Schematic illustrating primer design to differentiate spliced and unspliced viral transcripts. e-g, HeLa cells infected with WT or ΔE1B Ad5 (MOI=10) in the presence of DMSO or NEDDi (neddylation inhibitor MLN4924) added at 8 hours post-infection (hpi). Cells were harvested for RNA analysis at 24 hpi. e, Bar graph representing spliced RNA levels of viral early transcripts E1A by RT-qPCR, f, Bar graph representing splicing efficiency as the ratio of spliced to unspliced transcripts of E1A relative to the WT DMSO control by RT-qPCR. g, Representative RNA FISH visualizing the localization of fiber (green) and GAPDH (magenta) transcripts in relation to nuclear DNA stained with DAPI (blue). Nuclei are labeled with the classification of each cell according to the pattern of fiber used for Figure 1d. Scale bar=10 μm. All data are representative of two (g) or three (others) biologically independent experiments. All graphs show mean+SD. Statistical significance was calculated using a paired (a) or unpaired (others), two-tailed Student’s t-test, * p <0.05, ** p <0.01.
