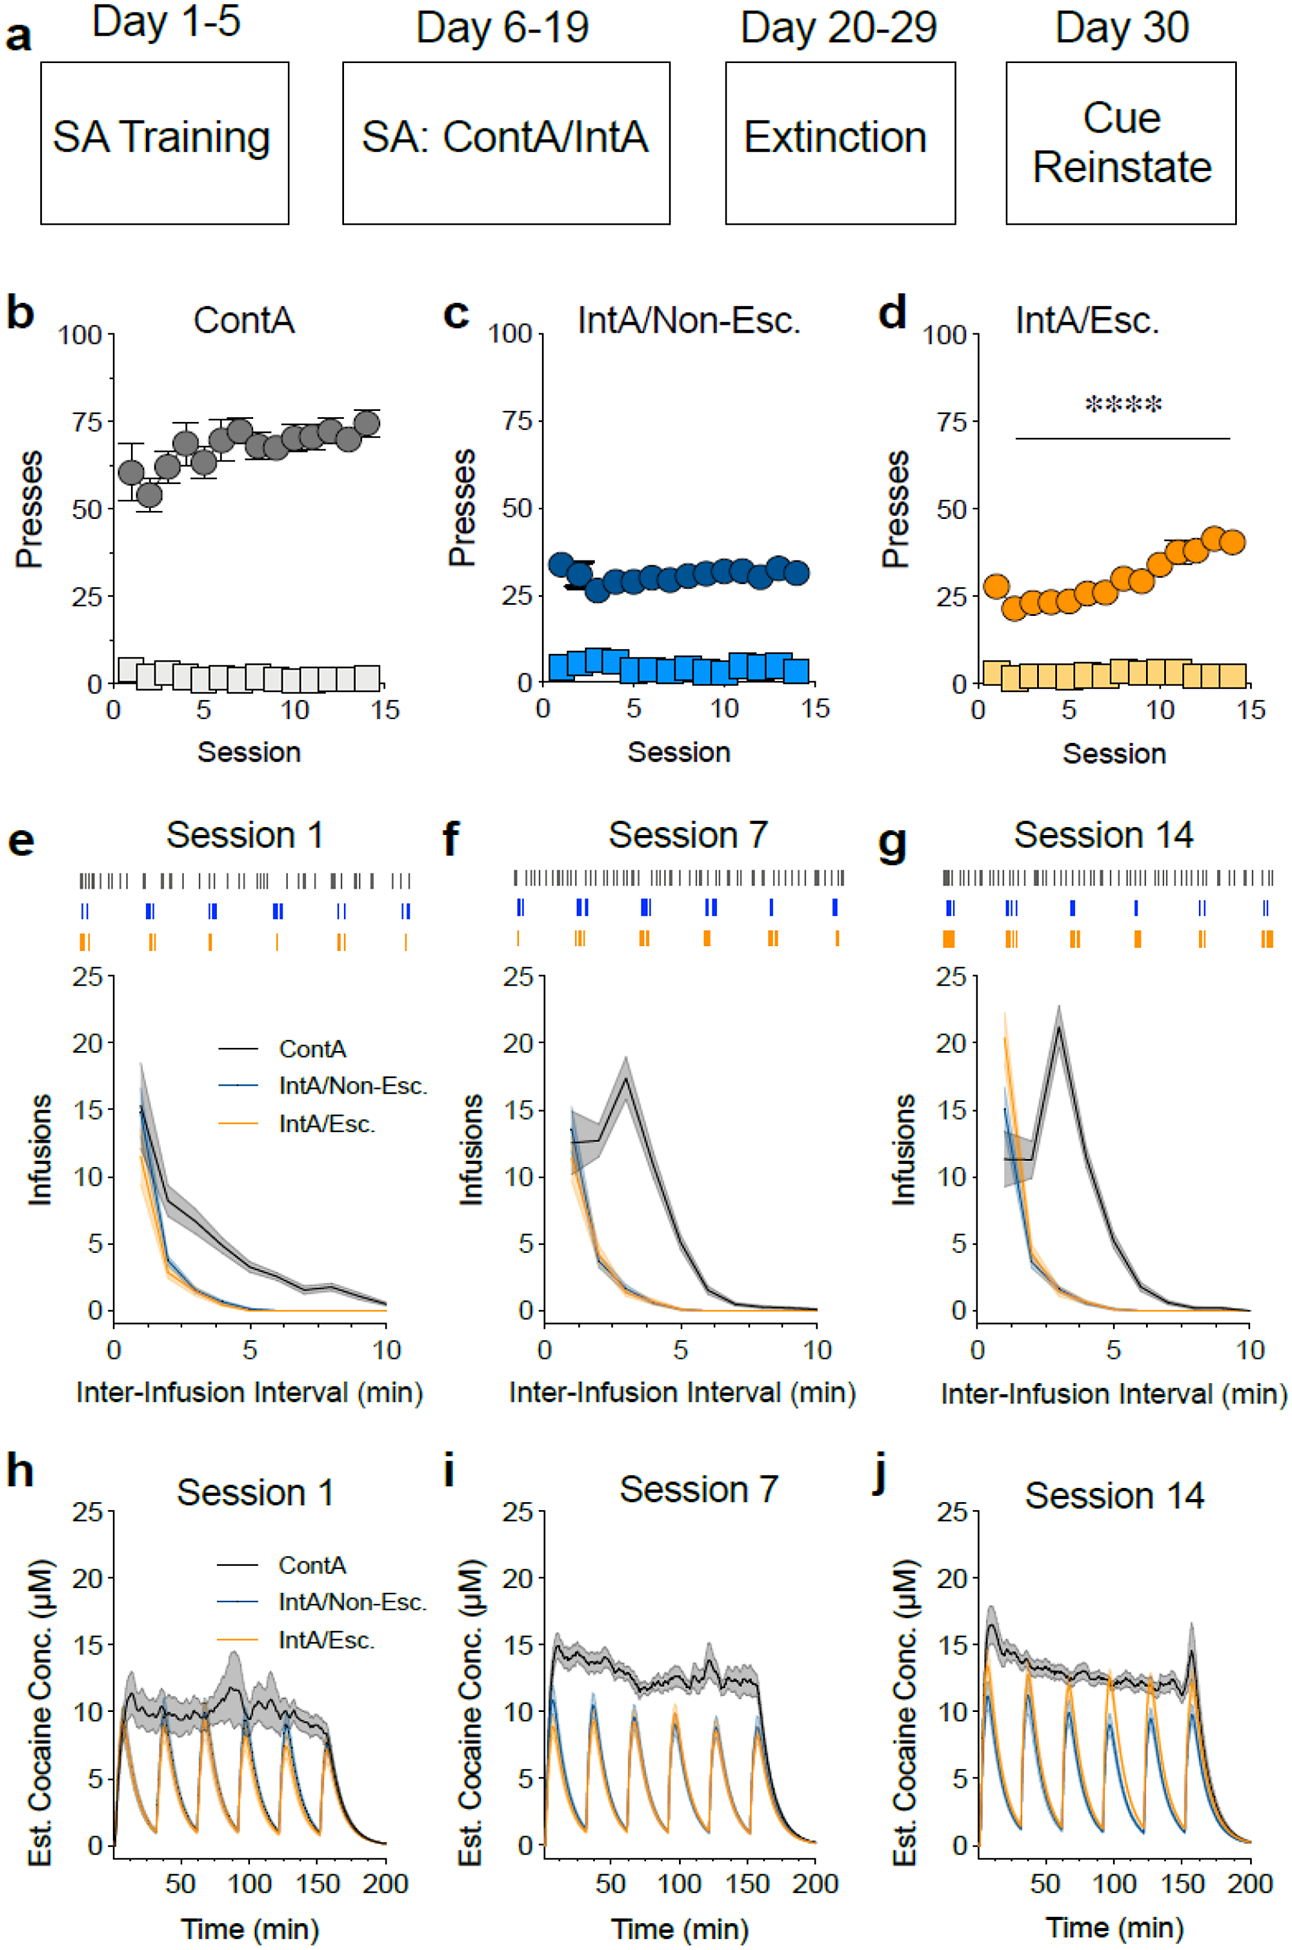
Figure 1. ContA and IntA paradigms produce different patterns of cocaine intake.

(a) Illustration of the self-administration paradigm. (b-d) Total active (circles) and inactive (squares) lever presses during self-administration training for the ContA group (b), the IntA non-escalator group (c) and the IntA escalator group (d). Although the ContA group had the greatest number of active presses, only the IntA escalator group significantly increased their drug intake across sessions (****p < 0.0001). (e-g) The total infusions earned at different inter-infusion intervals on the first (e), seventh (f) and fourteenth (g) session of self-administration. The IntA escalator group took significantly more infusions with short inter-infusion intervals compared to the IntA non-escalator group (p < 0.0001). Shaded portions represent SEM. Hash marks above the graphs indicate lever presses of representative animals. Gray symbols/lines represent the ContA group, blue symbols/lines represent the IntA non-escalator group and orange symbols/lines represent the IntA escalator group. (h-j) Estimated cocaine concentrations on the first (h), seventh (i) and fourteenth (j) session of self-administration. Cocaine concentrations were relatively stable in the ContA group following the loading phase whereas the IntA groups showed spikes in cocaine concentrations coinciding with the drug-available periods. Shaded portions represent SEM. N=21–32/group.
