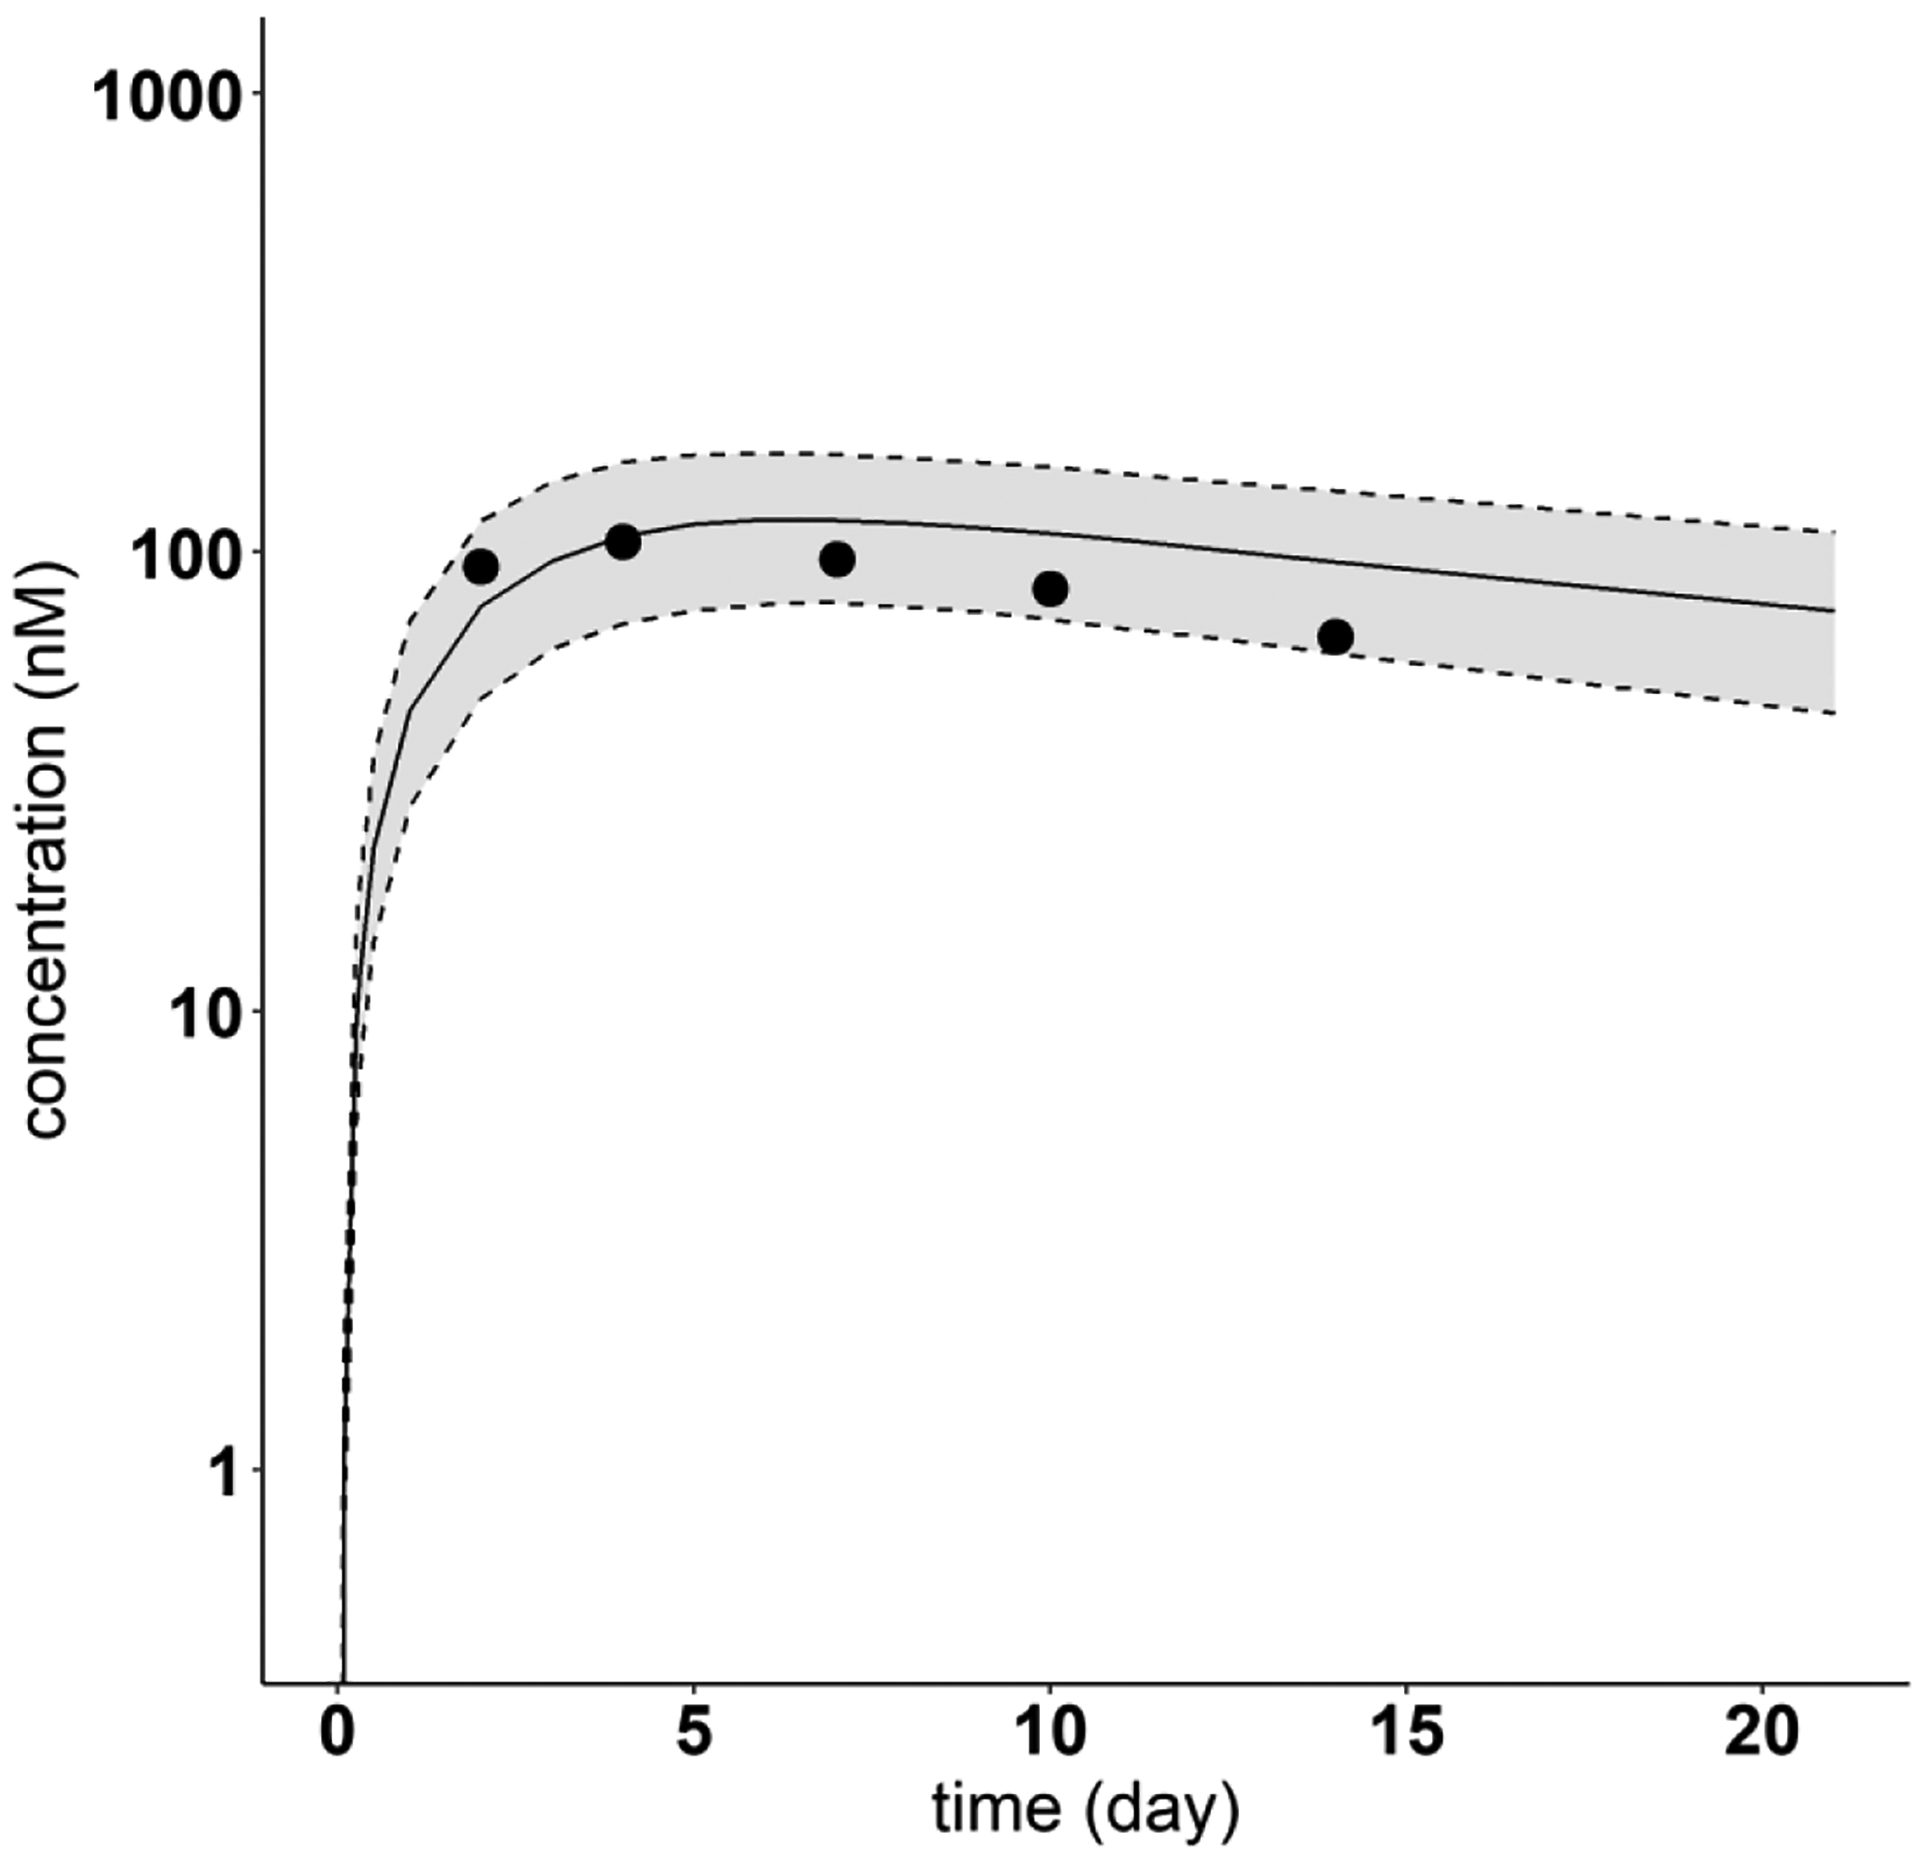
Fig. 10.

Model-predicted and digitized concentration versus time profiles for Ixekizumab. Filled dots indicate digitized Ixekizumab PK profiles from literature, after single SC dose of 160 mg. Solid lines show the predicted median. Dash lines indicate the predicted 5th and 95th percentiles. The shaded areas display the 5th to 95th percentile population simulation regions
