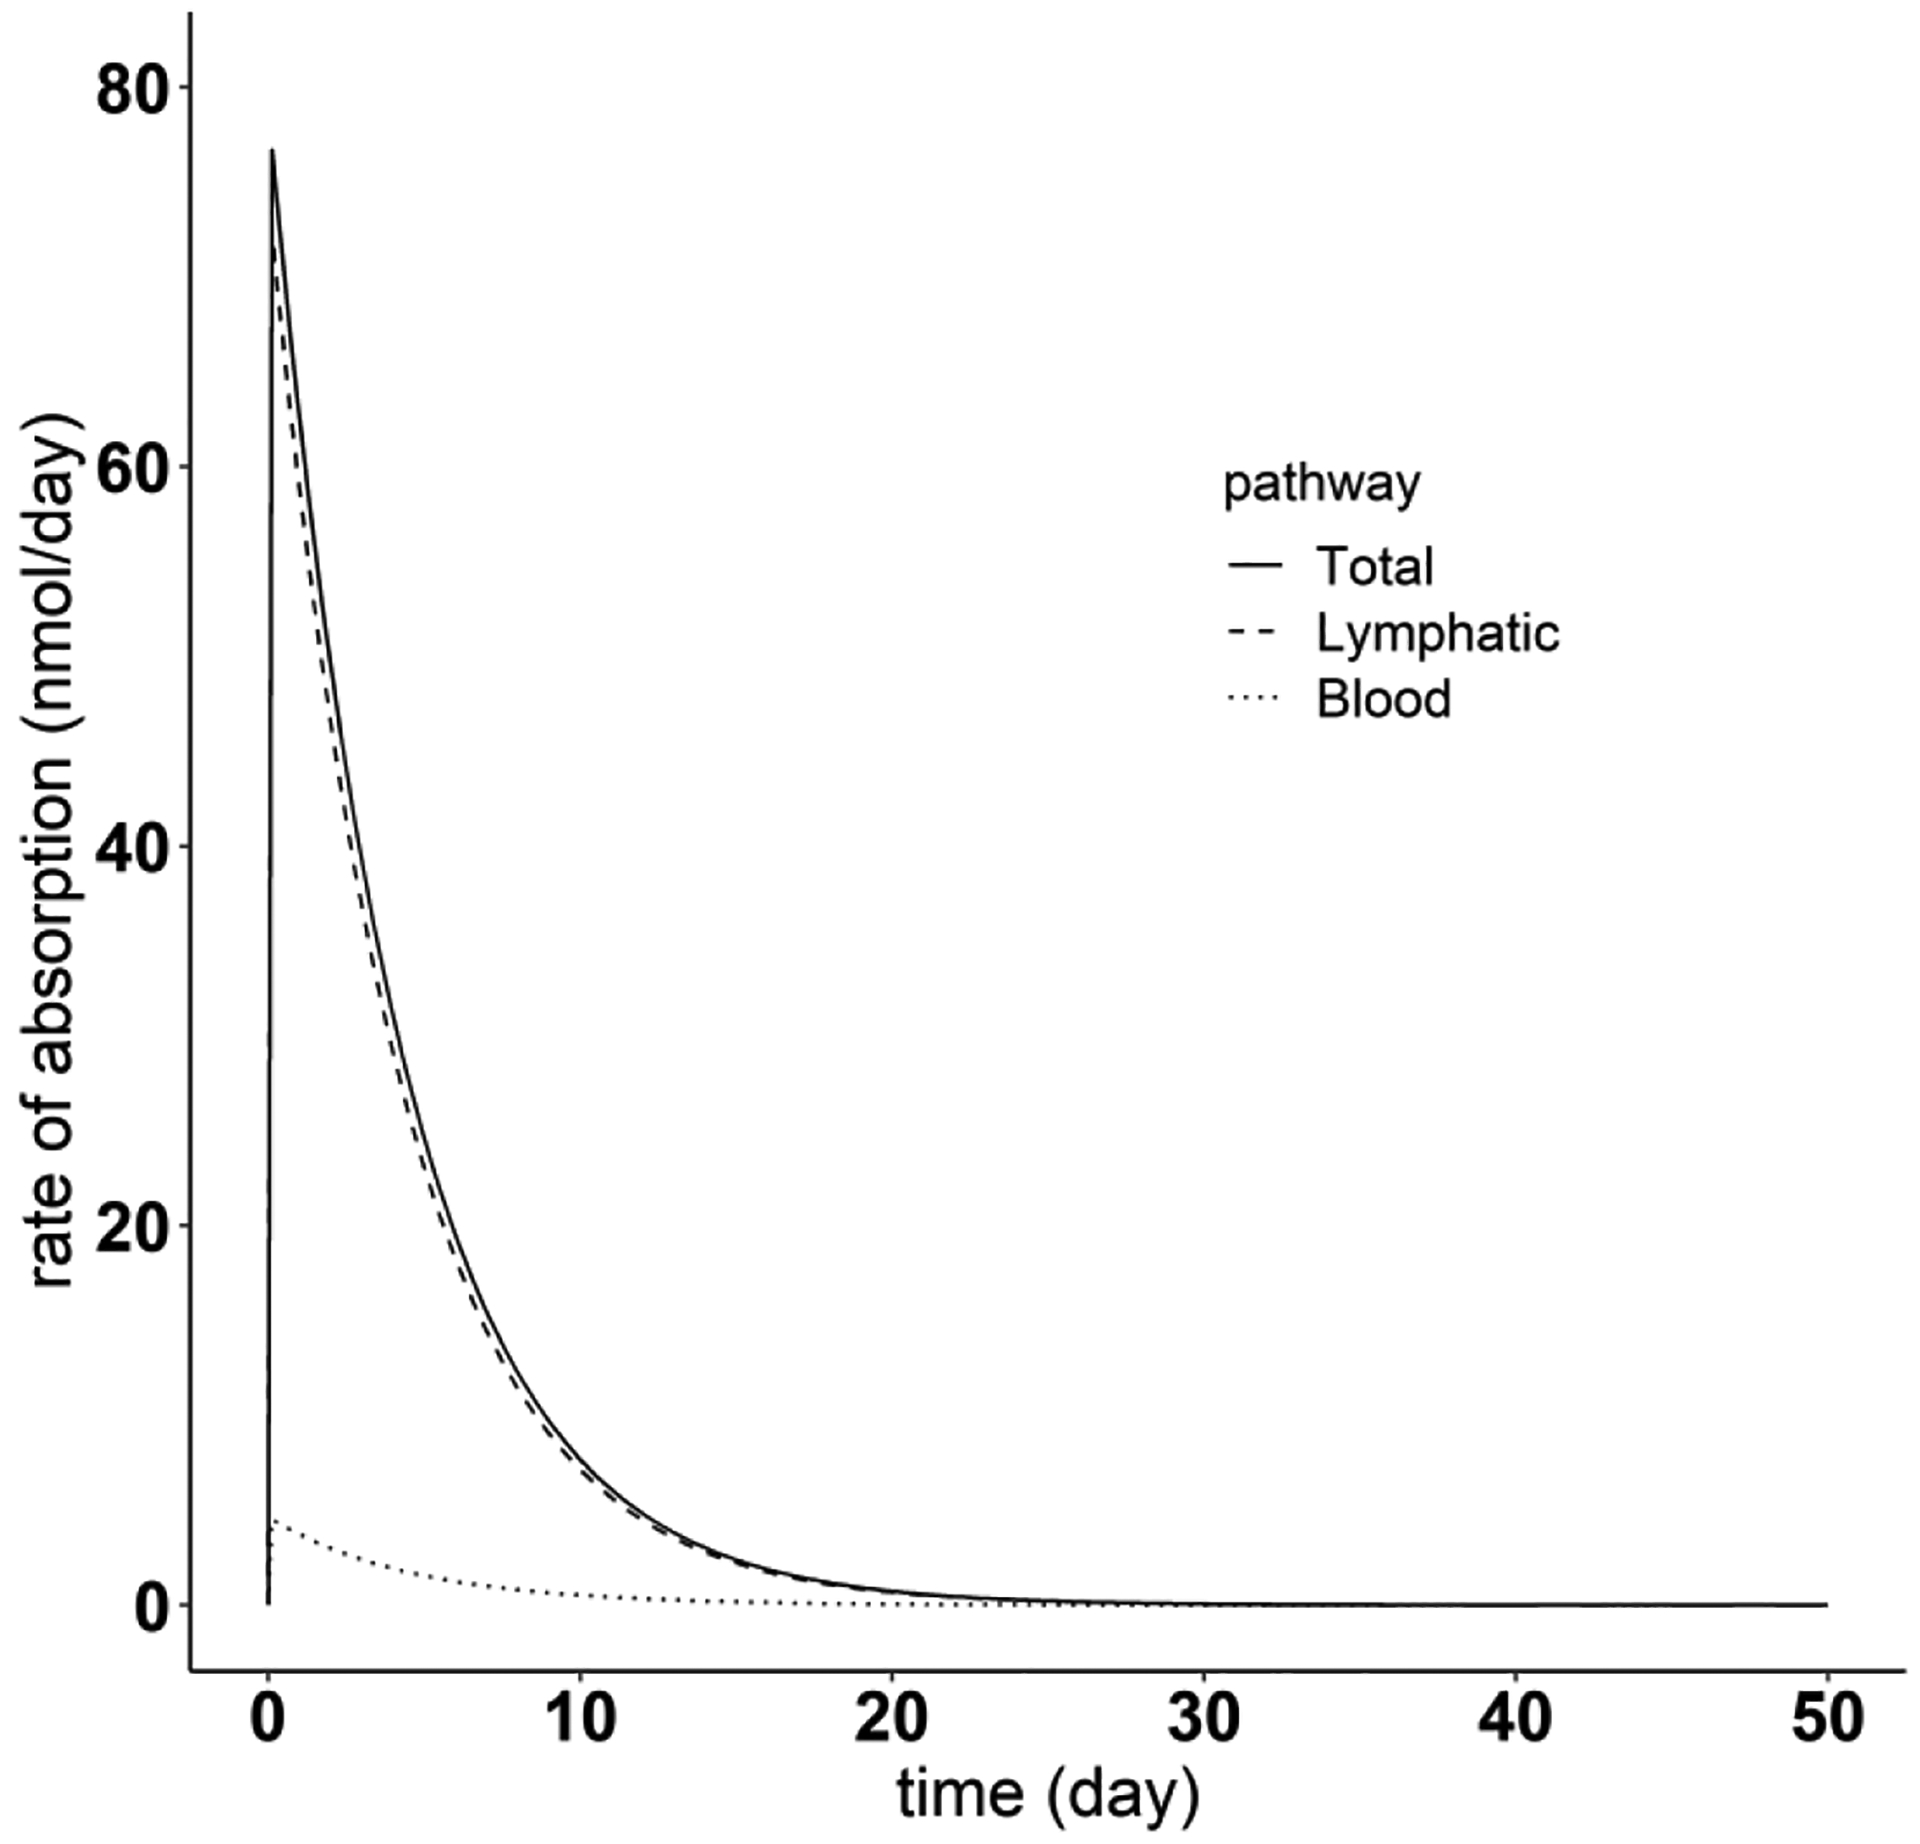
Fig. 12.

Simulation of absorption rate of different pathways after the SC dosing, using Golimumab as an example. The solid line represents the total absorption rate after SC administration. The dashed and dotted lines denote the mAb absorption rate through the lymphatic system and blood perfusion, respectively
