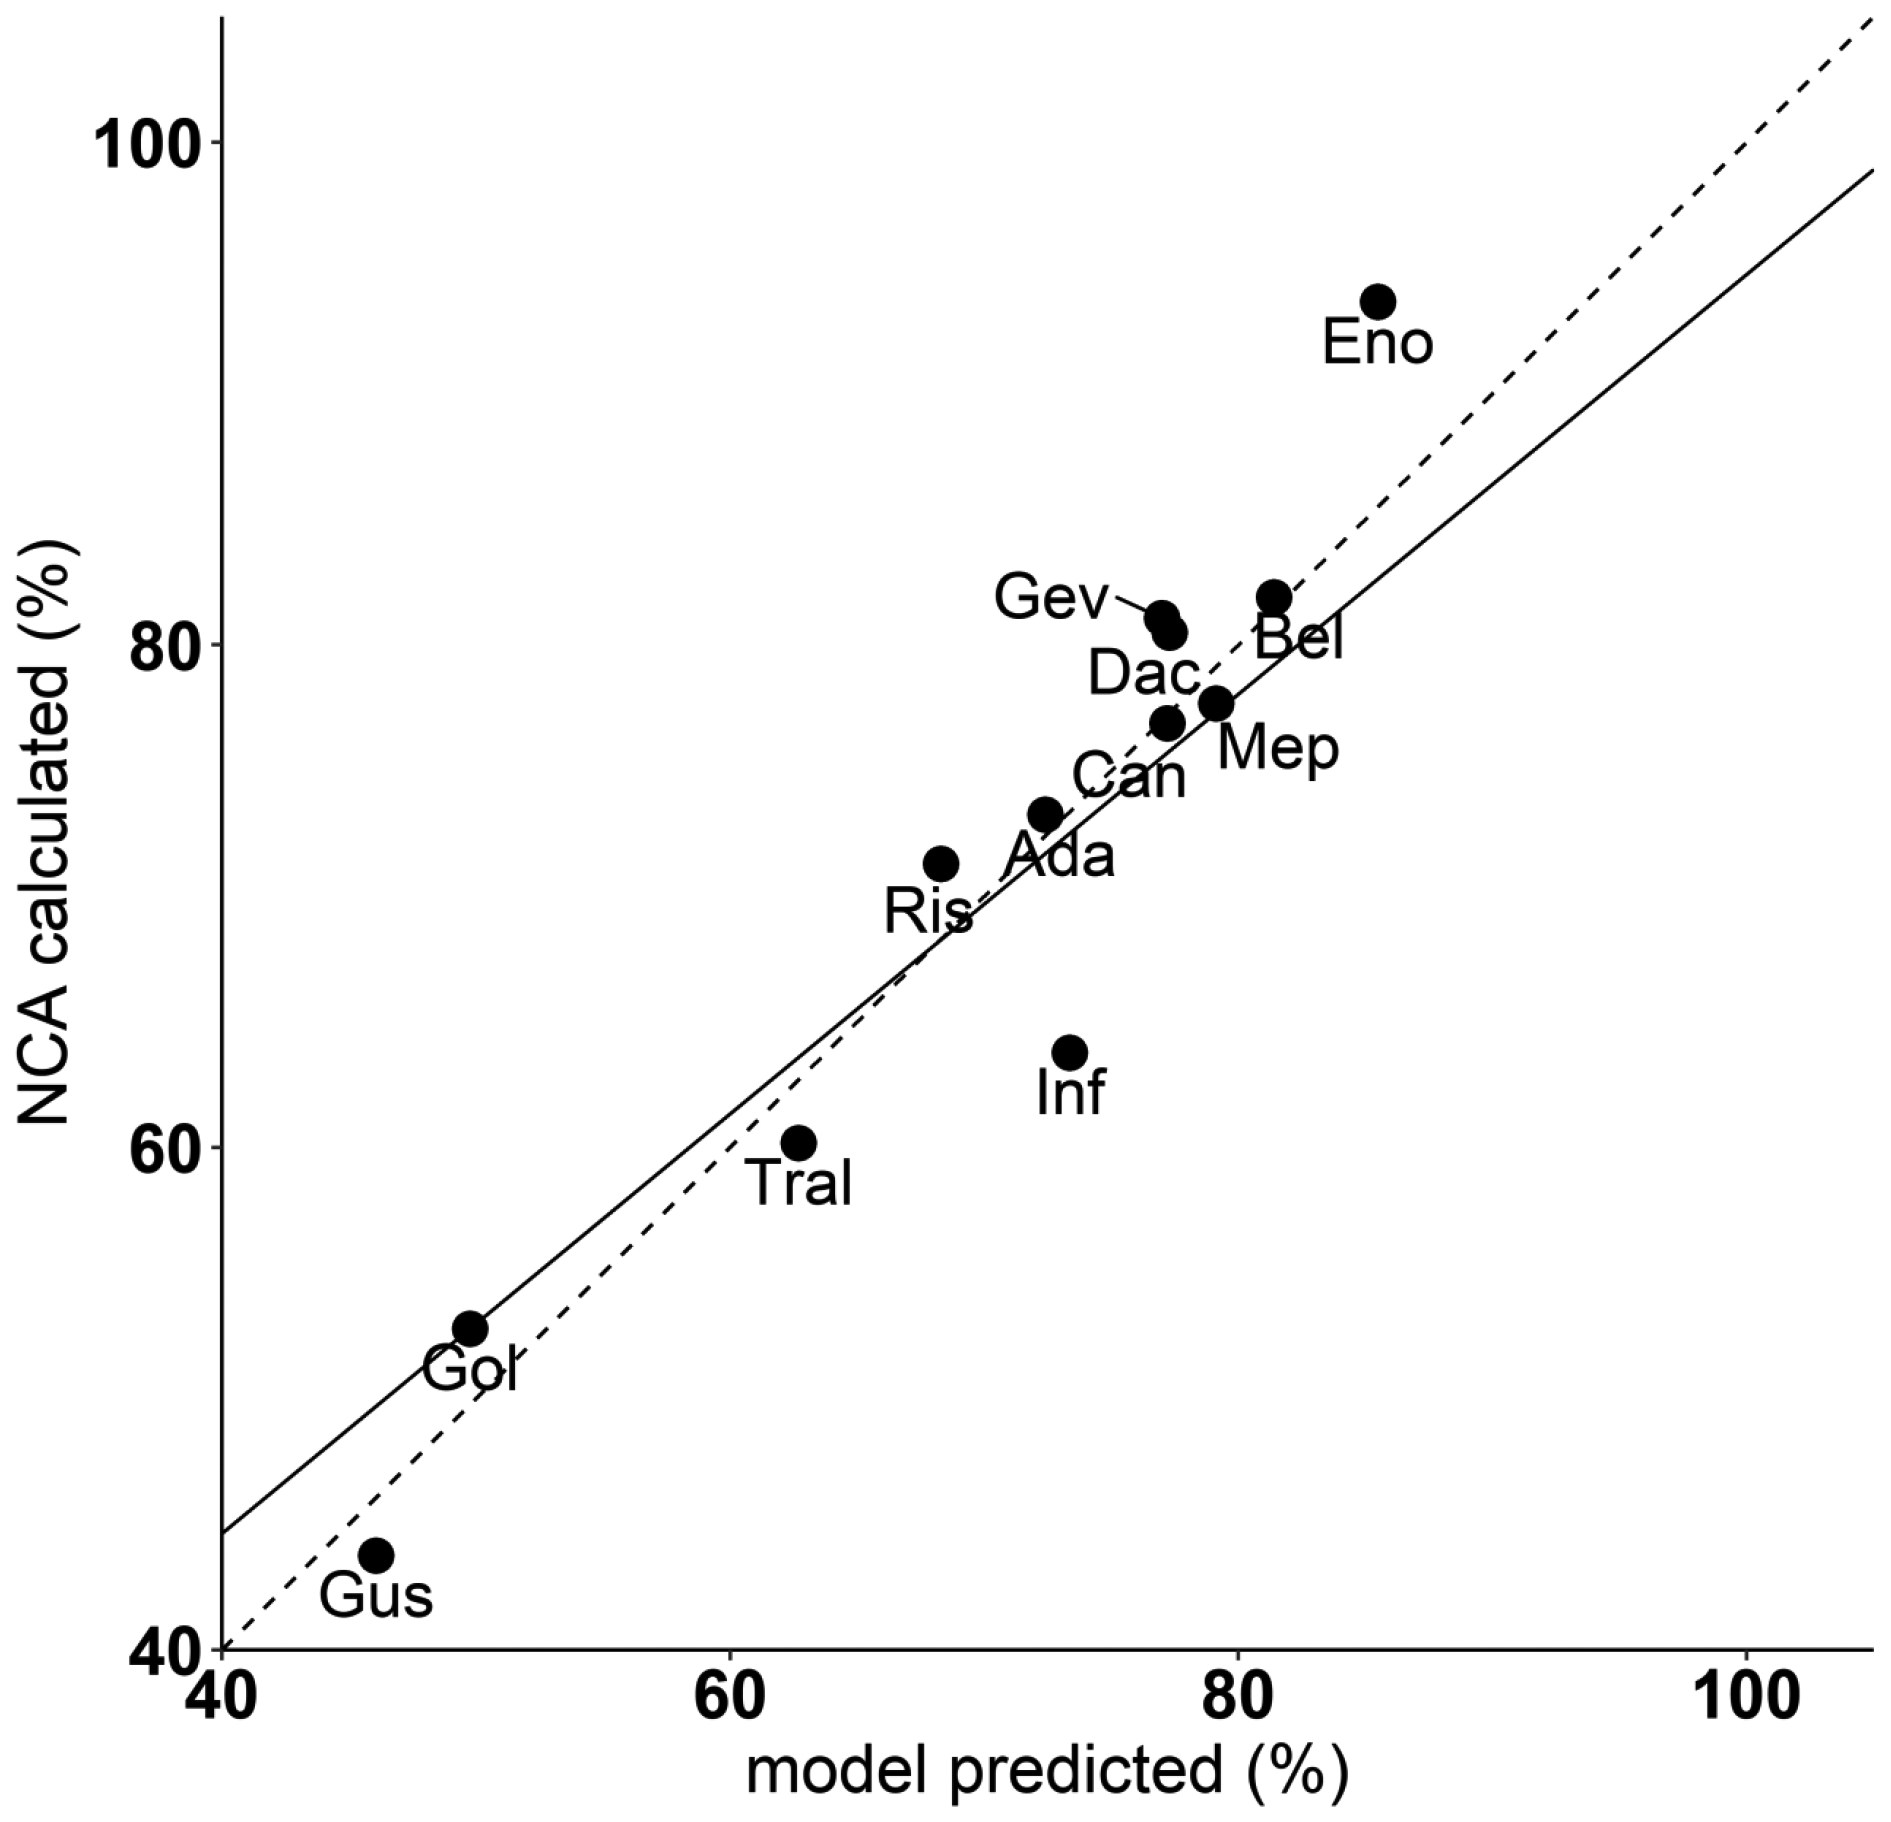
Fig. 5.

Linear correlation evaluation between NCA calculated bioavailability (%) and model predicted bioavailability (%). All mAbs with SC PK data are included. The solid line represents the regression line (R2 = 0.91). The dashed line represents the hypothetical line of identity
