
Fig. 6.
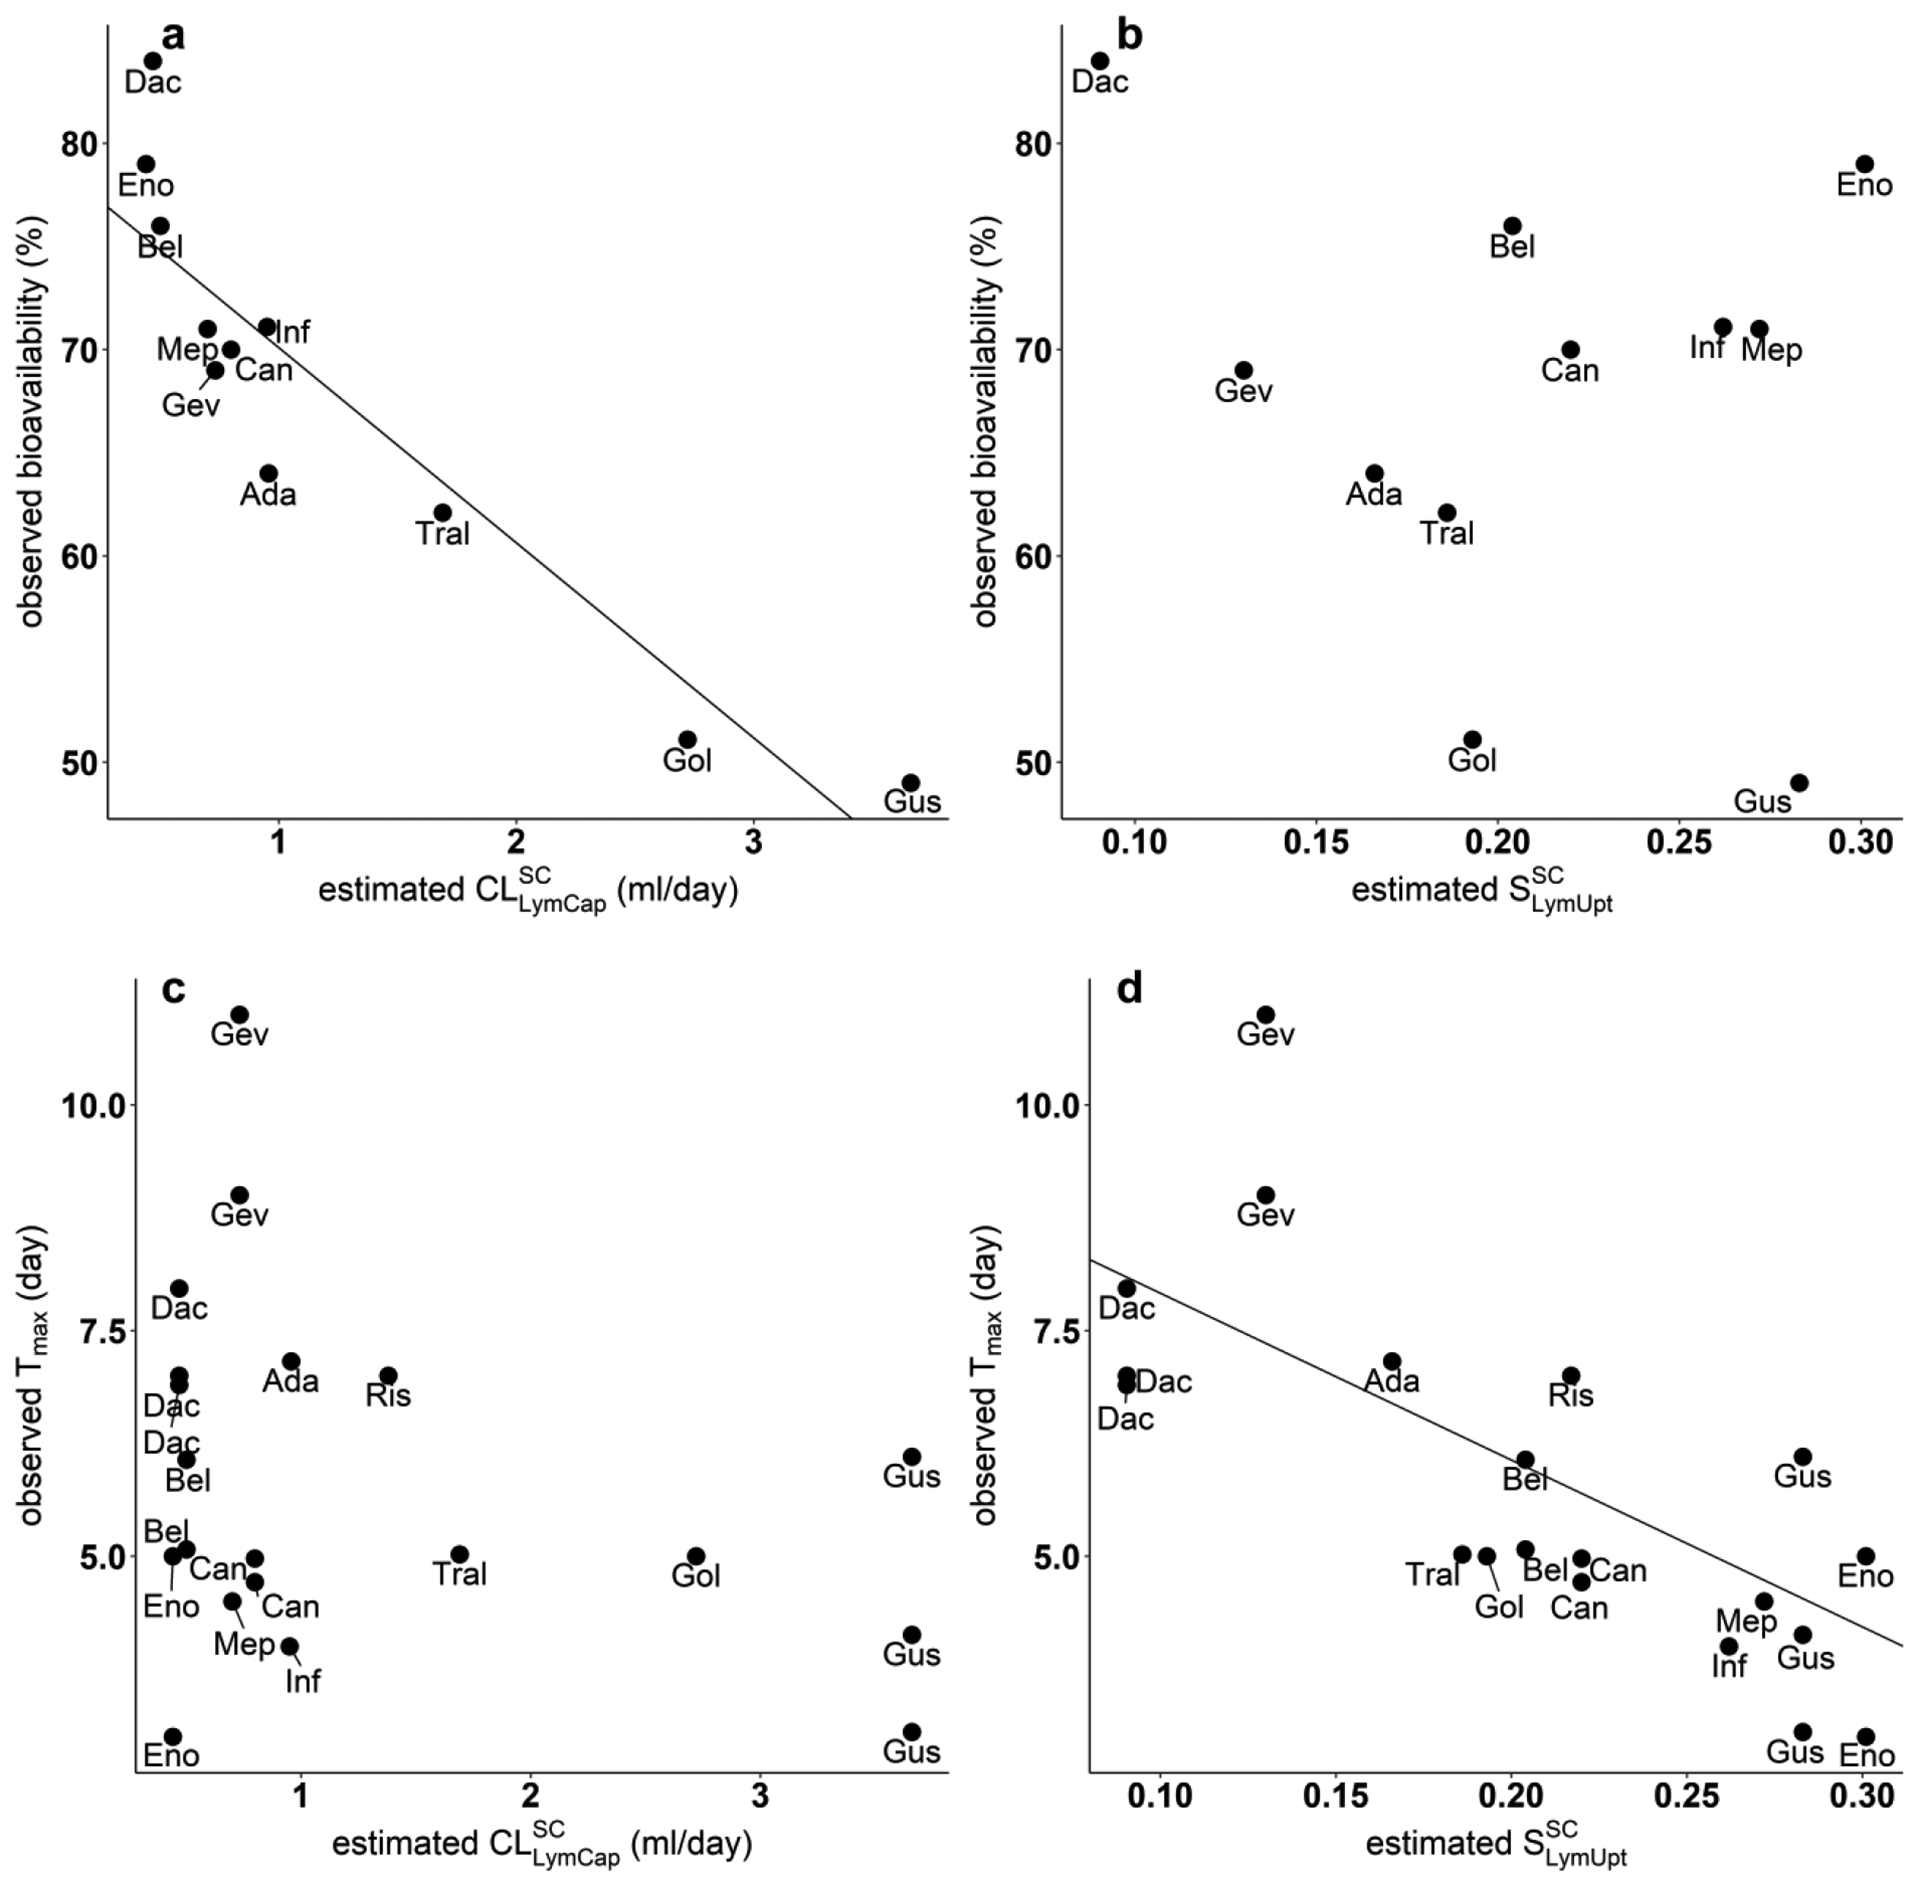
Correlation of observed SC PK characteristics versus estimated SC tissue model parameters. (a) Negative association between observed bioavailability (%) and estimated (p = 6.77×10−05). (b) No significant association between observed bioavailability (%) and estimated (p = 0.547). (c) No significant association between observed Tmax (day) and estimated (p = 0.217). (d) Negative correlation between observed Tmax (day) and estimated (p = 0.000143).