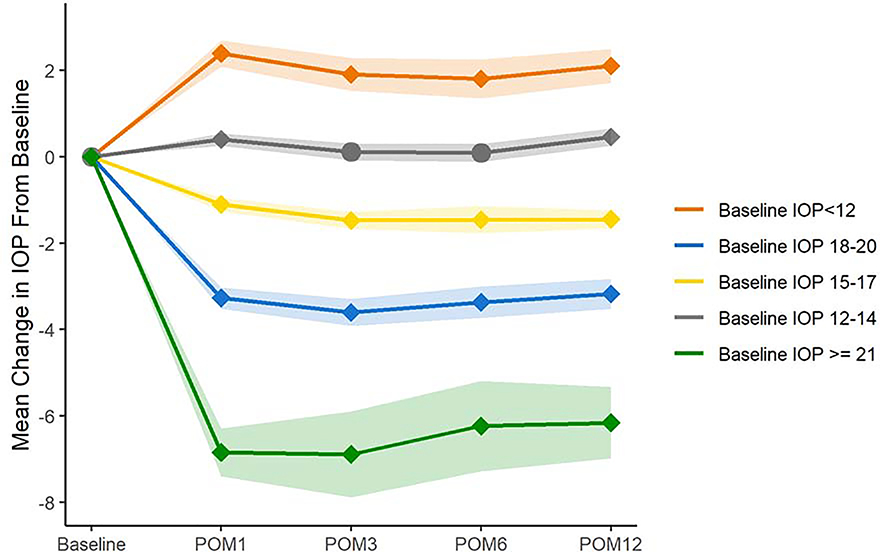
Figure 3. Mean Change in Intraocular Pressure After Cataract Surgery Stratified by Baseline Intraocular Pressure.
Legend: The figure depicts the mean change in intraocular pressure after cataract surgery at postoperative months 1, 3, 6, and 12, Patients were stratified by baseline IOP. Diamond-shaped markers indicate a statistically significant difference in mean IOP compared to baseline for that group (P<0.0001, paired t-tests). Bands indicate 95% confidence intervals.
POM = postoperative month. IOP = intraocular pressure.

