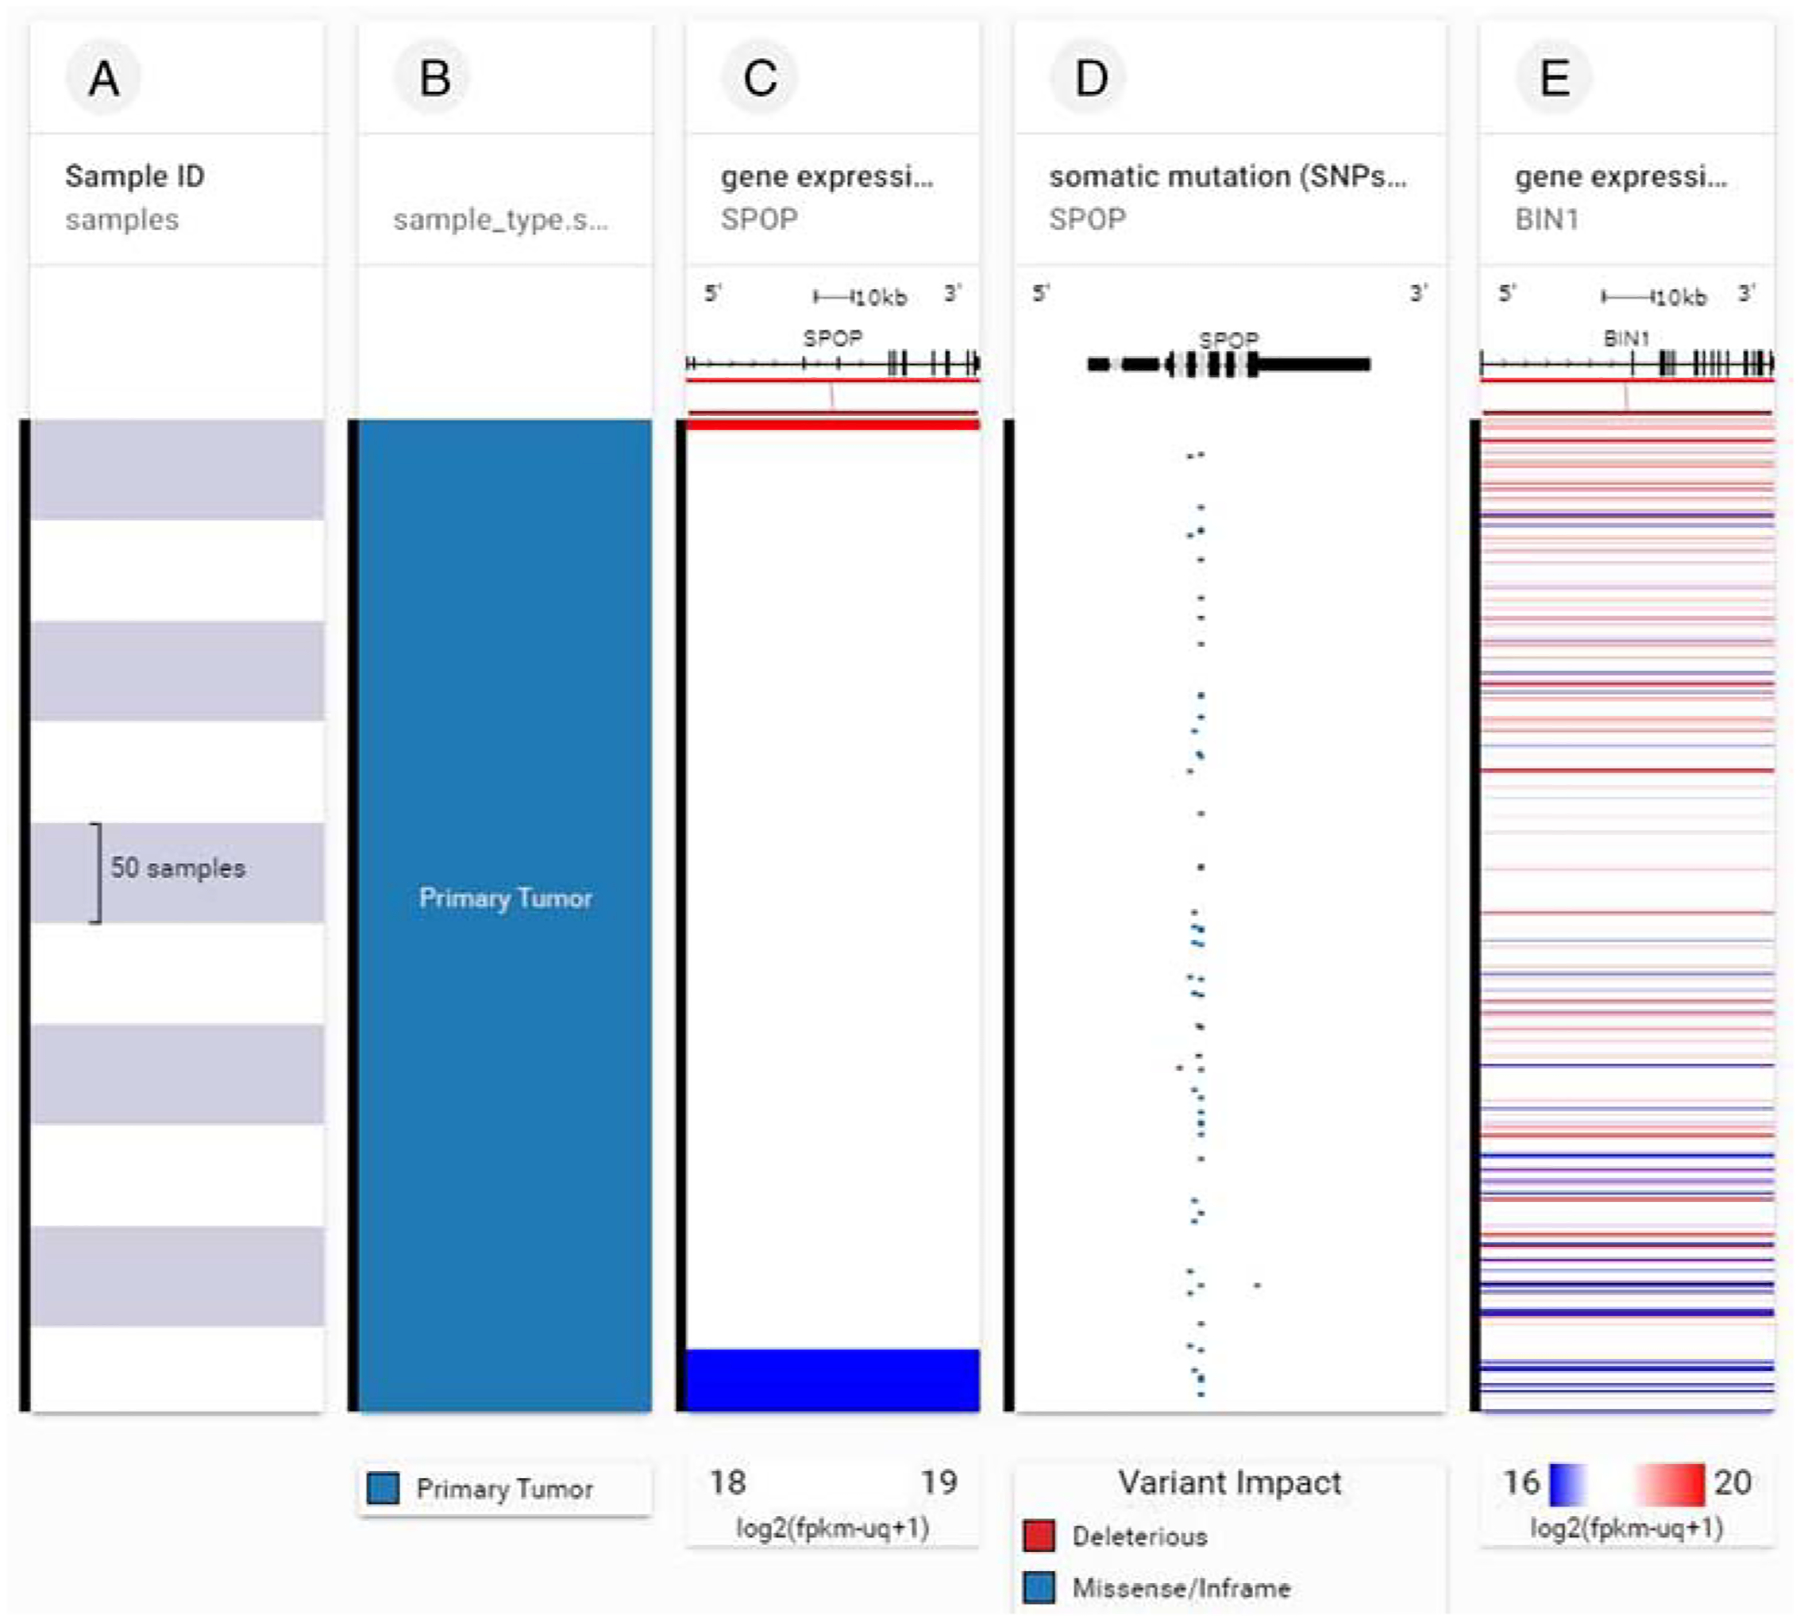
FIGURE 3.

SPOP gene expression, SPOP somatic mutations, and BIN1 gene expression in 492 primary prostate cancer samples. Column A indicates number of samples, column B indicates that all samples were primary tumor. Note that the presence of somatic mutations (deleterious and missense/in frame) in SPOP (column D) deranges BIN1 gene expression (multicolored horizontal lines, column E). Each row contains data from a single sample. Row order is determined by sorting the rows by their column values. The column C value is used to sort the rows. (xenabrowser.net).
