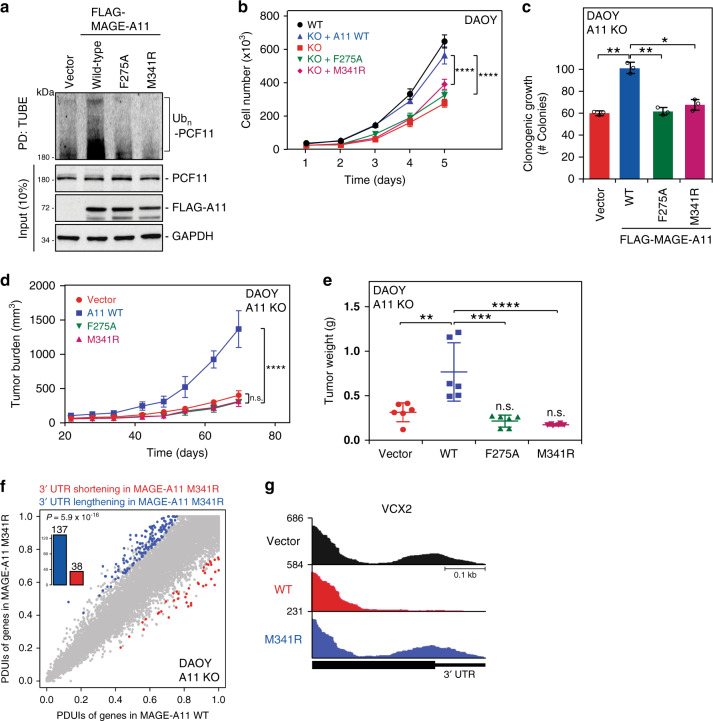
Fig. 3. Mutation of MAGE-A11 SBC disrupts its oncogenic activity.
a MAGE-A11-induced ubiquitination of PCF11 depends on its substrate recognition by MAGE-A11 SBC. Ubiquitinated proteins from FLAG-vector, FLAG-MAGE-A11 wild-type, or SBC mutants stably expressing HEK293FT cells were treated with 10 µM MG132 for 4 h and isolated with tandem ubiquitin binding entity-agarose followed by SDS-PAGE and immunoblotting for endogenous PCF11. Source data are provided as a Source Data file. b MAGE-A11 SBC mutants fail to promote proliferation of MAGE-A11 knockout DAOY cells. Wild-type, MAGE-A11-knockout DAOY cells, or those reconstituted with MAGE-A11 were counted for cell proliferation at the indicated time points (n = 3 biologically independent experiments per group). Data are mean ± SEM. p-value by two-way ANOVA followed by Tukey’s multiple comparisons test is indicated (****P < 0.0001). c–e MAGE-A11 knockout DAOY cells reconstituted with MAGE-A11 SBC mutants reduced clonogenic growth and xenograft tumor growth of MAGE-A11 knockout DAOY cells. Stable expression of wild-type MAGE-A11 or SBC mutants in MAGE-A11-knockout DAOY cells were assayed for clonogenic growth (c) (n = 3 biologically independent experiments per group, two-tailed unpaired Student’s t test, *P < 0.05; **P < 0.01), Data are mean ± SEM and xenograft tumor growth in mice (n = 6 per group). Tumor burden (d) and tumor weight (e) are shown. Data are mean ± SD. p-value by two-way ANOVA followed by Tukey’s multiple comparisons test is indicated in d (****P < 0.0001), ordinary one-way ANOVA followed by Sidak’s multiple comparisons test is indicated in e (**P < 0.01, ***P < 0.001, ****P < 0.0001). Red circle, Vector; Blue square, MAGE-A11 WT; Green triangle, MAGE-A11 F275A; and Pink triangle, MAGE-A11 M341R. f MAGE-A11 M341R mutant fails to promote mRNA 3’UTR shortening. Transcriptome analysis of tumors (n = 3 per group) from MAGE-A11 knockout DAOY cells stably expressing FLAG-MAGE-A11 wild-type or M341R mutant was determined and scatterplot of Percentage of Distal polyA site Usage Index (PDUI) is shown. False discovery rate ≤ 0.05 and ΔPDUIs ≥ 0.2 are colored. The shift towards distal polyadenylation site is significant (p = 5.9 × 10⁻¹⁶, binomial test). g Representative RNA-seq density plots are shown.

