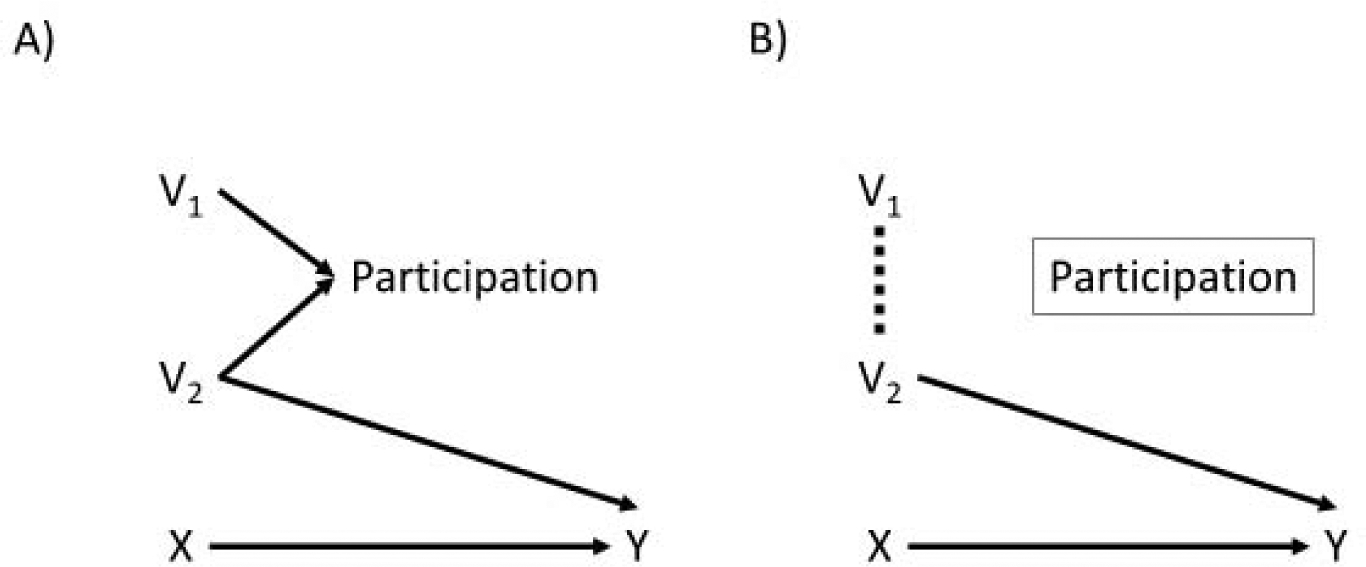
Figure 1.

Two directed acyclic graphs. Panel A shows the causal relationships between V1, V2, X, participation, and Y in the source population; since there is no open path from V1 to Y in panel A, V1 will not modify the treatment effect of X on Y. Panel B shows the causal relationships between the same variables in the study population. Because we are conditioning on study participation, which depends on V1 and V2, there is now an open path from V1 to Y that can make V1 act as an effect modifier in the study population.
