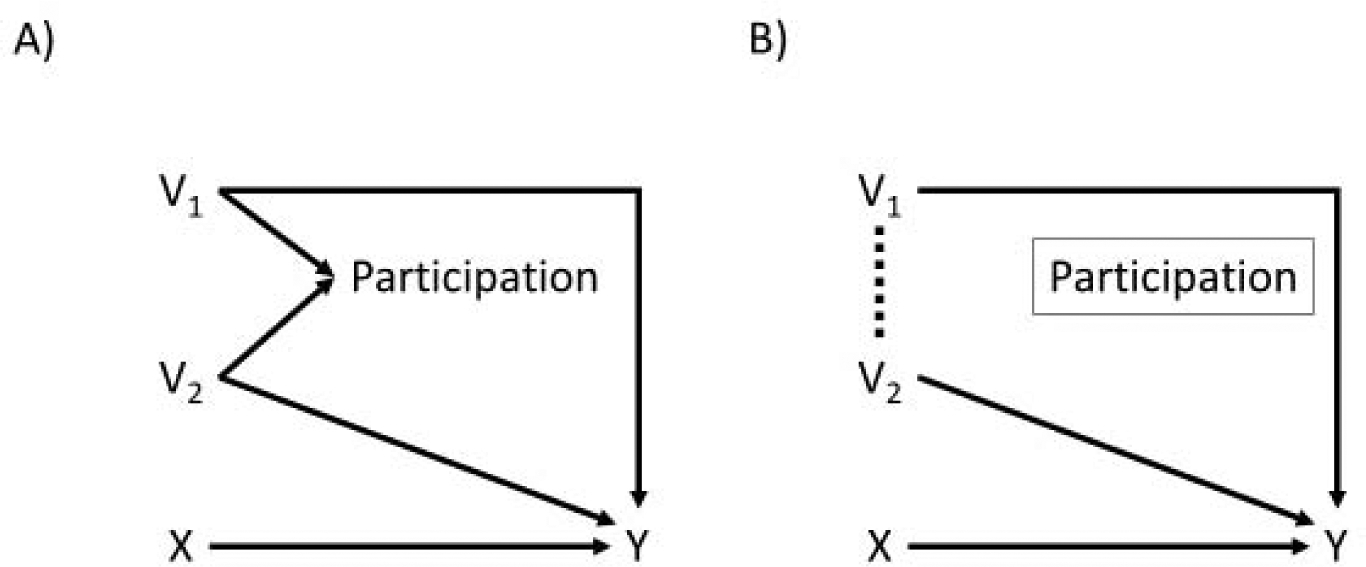
Figure 2.

Directed acyclic graphs for when both V1 and V2 directly modify the treatment effect of X on Y. Panel A is the directed acyclic graph for the full population, while Panel B is the directed acyclic graph for the trial population. Both variables now have arrows indicating a causal effect on Y, and as a result both V1 and V2 are expected to have a different association with Y before and after conditioning on study participation.
