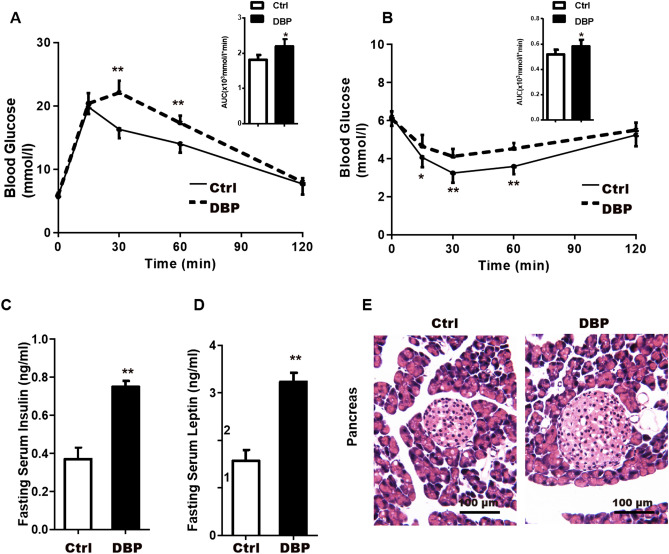
Figure 2.
Intrauterine exposure to DBP induces glucose metabolic disorder in offspring. (A) Glucose tolerance and the area under the curve (AUC) at 21 weeks. (B) Insulin sensitivity and the area under the curve at 21 weeks. (C) The levels of fasting serum insulin. (D) The levels of fasting serum leptin. (E) Hematoxylin–eosin (H&E) staining of the pancreas tissue, Scale bars = 100 μm. Data are expressed as the mean ± SD, n = 10 per group, *p < 0.05, **p < 0.01 versus the Ctrl group.

