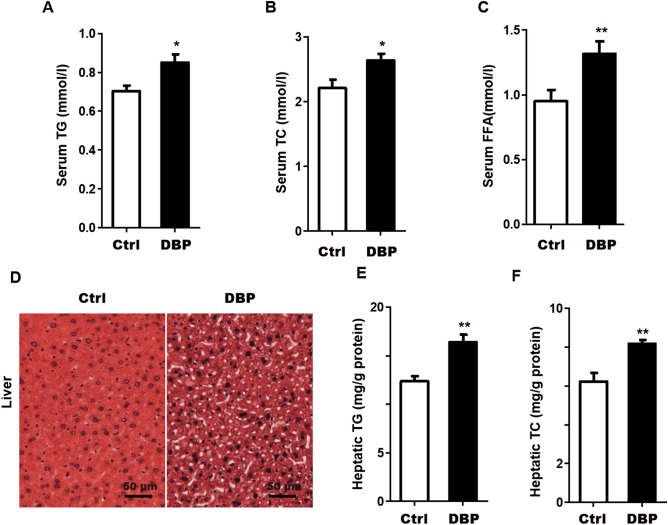
Figure 3.
Serum and liver factors associated with obesity and lipid metabolism disorder. (A) Serum triglycerides, TG. (B) Serum total cholesterol, TC. (C) Serum free fatty acid, FFA. (D) Lipid droplets in liver slices were observed by oil red O staining, Scale bars = 50 μm. (E) Hepatic triglyceride, TG. (F) Hepatic total cholesterol, TC. Data are expressed as the mean ± SD, n = 10 per group, *p < 0.05, **p < 0.01 versus the Ctrl group.

