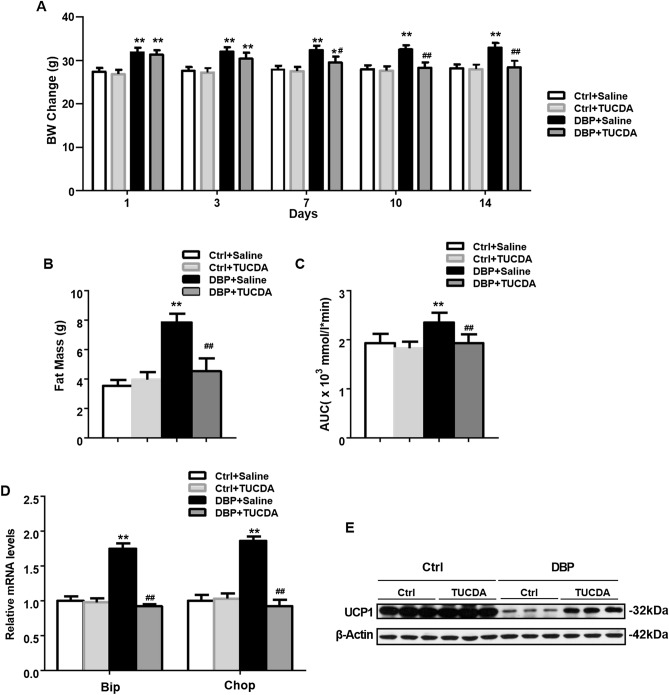
Figure 6.
TUDCA treatment inhibited obesity in mice by up-regulating UCP1 expression. (A) Body weight change during 1–14 days in offspring. (B) Fat mass at the 14 day. (C) Area under curve of glucose. (D) The relative mRNA levels of Bip and Chop analyzed by RT-PCR. (E) Protein levels of UCP1. All data above were expressed as the mean ± SD of three independent experiments. Their corresponding full-length blots are presented in Supplementary Fig. S3. Data are expressed as the mean ± SD, n = 10 per group, *p < 0.05, **p < 0.01 versus the Ctrl + Saline group, #p < 0.05, ##p < 0.01 versus the DBP + Saline group.

