
Extended Data Fig. 10. RA fraction in introgressed haplotypes containing eQTL in GTEx tissues.
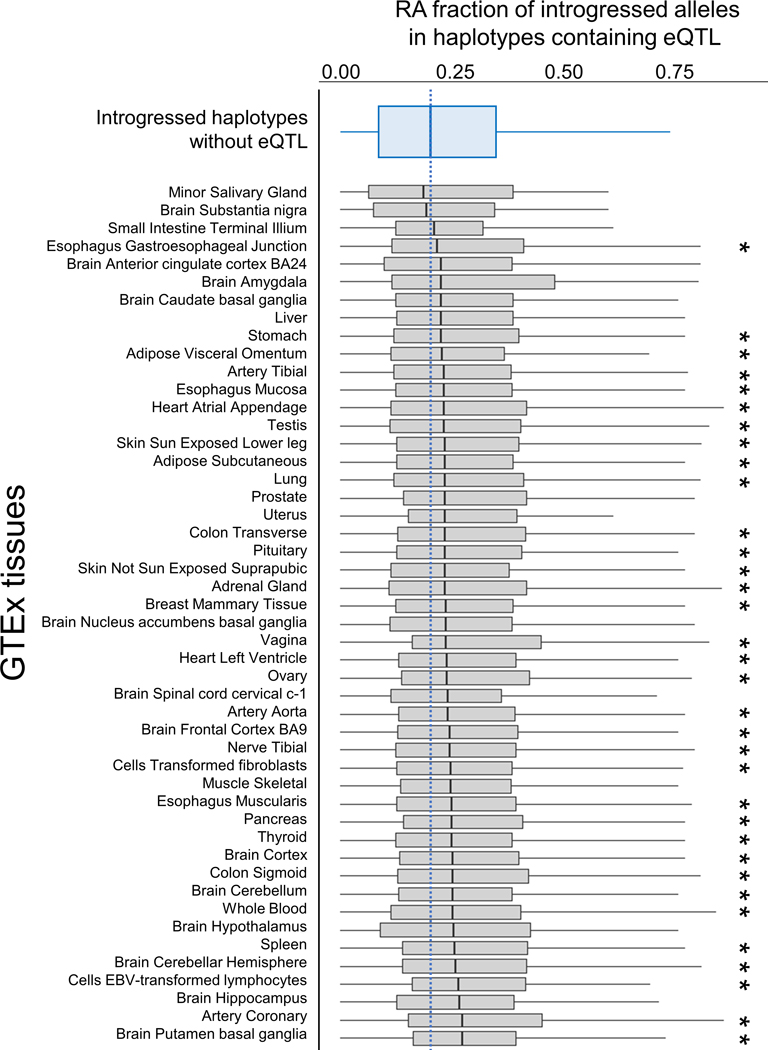
Summary of the RA fraction among introgressed variants in Neanderthal haplotypes in Europeans (EUR). Boxplots show the distributions RA fractions of all haplotypes containing at least one introgressed eQTL (RA or NDA) in the given GTEx tissue (gray box plots). These distributions are then compared pairwise with distribution for introgressed haplotypes that contain no introgressed GTEx eQTL (top, blue boxplot; n=4237). Haplotypes containing GTEx eQTL have RA contents higher than non-eQTL containing haplotypes in 46 tissues, with 34 of the tissues (*) having a significantly higher the RA fraction (P<0.05, Mann Whitney U Test).