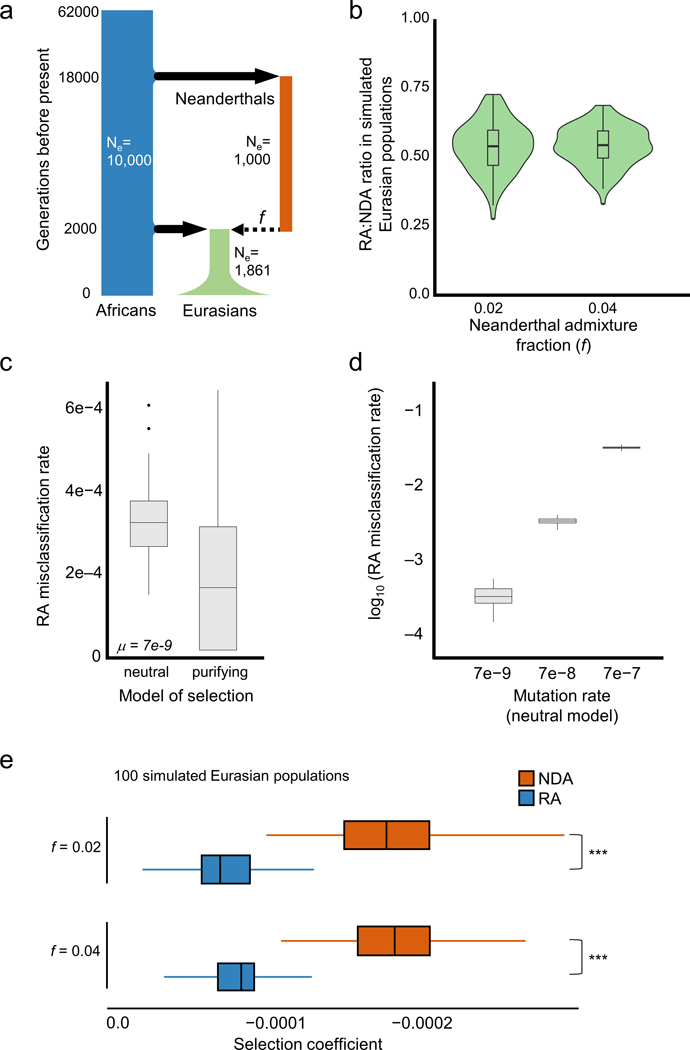
Extended Data Fig. 2. Evolutionary simulations suggest that RAs are common and more tolerated than NDAs.

a) The demographic model used to simulate human–Neanderthal admixture and quantify the reintroduction of lost alleles. The model and effective population sizes (Ne) were based on previous simulations of Neanderthal admixture. We considered models in which mutations incurred a fitness cost (mildly purifying selection) or no fitness cost (strict neutrality). Two different admixture fractions (f=0.02 and f=0.04) and three mutation rates were used in the simulations (Methods). b) The ratios of RAs to NDAs over 100 simulated Eurasian populations. The simulations predict approximately one RA for every two NDAs, and these estimates are robust to changes in the simulated Neanderthal admixture fraction. Misclassification of non-RAs as RAs due to independent, convergent mutations is extremely rare and the overall false discovery rate for LD-based RA identification is below ~1% (Table S3). While these forward time simulations only approximate the demographic histories of these populations, the observed RA-to-NDAs ratio are qualitatively consistent with the simulations (Figure 2). (c) Boxplots summarize the frequencies of these potentially confounding NDAs among all sites that would be called as RAs at the time of admixture (c.f. Figure 1). The incidence of these confounding mutations is slightly higher under a purely neutral model (left) than under a model in which new mutations can be deleterious (right). (d) Comparison of the effect of elevated mutation rates on the incidence of potentially confounding variants. Under a neutral model, the false positive rate scales with the mutation rate. The highest rate (μ= 7e-7) provides an estimate for CpG sites and results in a 3% false positive rate. Each boxplot represents 100 simulated populations. e) Selection coefficients in Eurasians from SLiM simulations with high (0.04) and low (0.02) admixture fractions. Each boxplot summarizes the average selection coefficient of all alleles in each introgressed class in each of 100 simulated modern Eurasian populations. The differences between the selection coefficients between RAs and NDAs is large and not dependent upon admixture fraction (~2.5x, P ≈ 0, Mann Whitney U test test).
