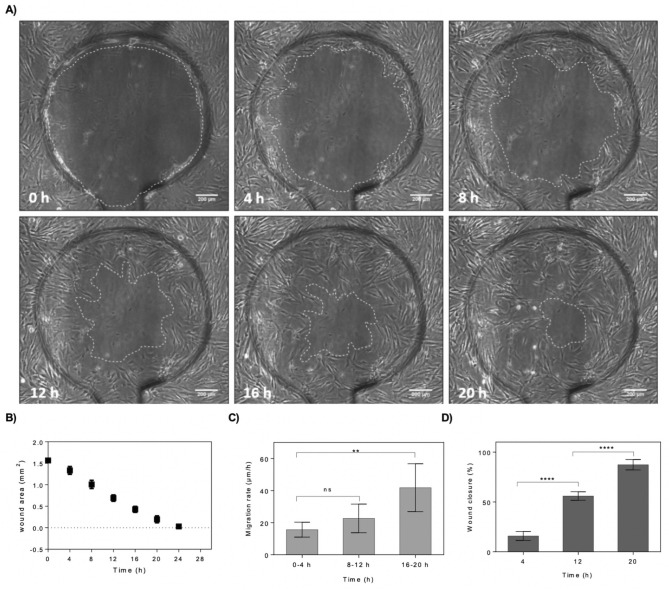
Figure 4.
On-chip evaluation of wound closure and cell migration of wounded fibroblast monolayers maintained under standard culture conditions and complete culture medium. (A) Time-lapse images of the wound defect at 0, 4, 8, 12, 16 and 20 h post-wounding. The wound edges where the membrane interfaced the microchannel surface are highlighted with dashed lines. (Scale bar = 200 µm). (B) Analysis of average wound area as a function of cultivation time. (n = 4). (C,D) Average cell migration rate of four hour intervals for three individual time windows including 0–4 h, 8–12 h and 16–20 h post-wounding (C), and wound closure at three selected time-points including 4, 12 and 20 h post-wounding (D). Data is expressed as mean ± SD. Data sets were tested with unpaired student’s t-test with 99% confidence level, ns non-significant, **p < 0.01, ***p < 0.001, ****p < 0.0001.

