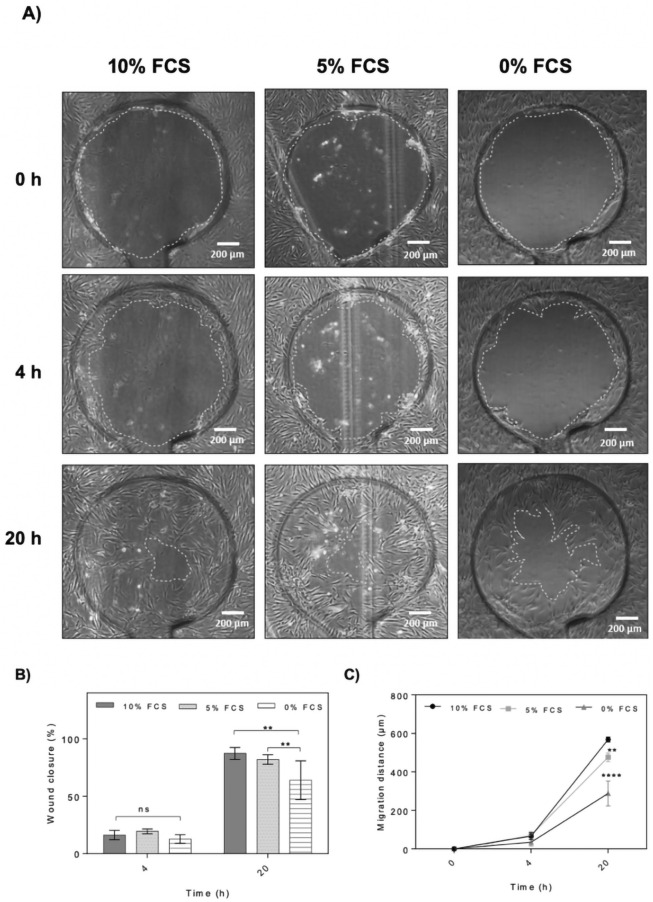
Figure 6.
Effect of serum starvation on on-chip HDF cell migration and wound closure. (A) Representative phase contrast images of wound defects at 0, 4 and 20 h. The wound edges are highlighted with dashed lines. (Scale bar = 200 µm). (B,C) Comparison of wound closure and migration distance of dermal fibroblast monolayers in the presence of 10%, 5% and 0% serum supplement at 0, 4 and 20 h post-wounding. Data is expressed as mean ± SD. Data sets were tested with unpaired student’s t-test with 99% confidence level, ns non-significant, **p < 0.01, ***p < 0.001, ****p < 0.0001. (Control n = 5; bFGF n = 6; MMC n = 6).

