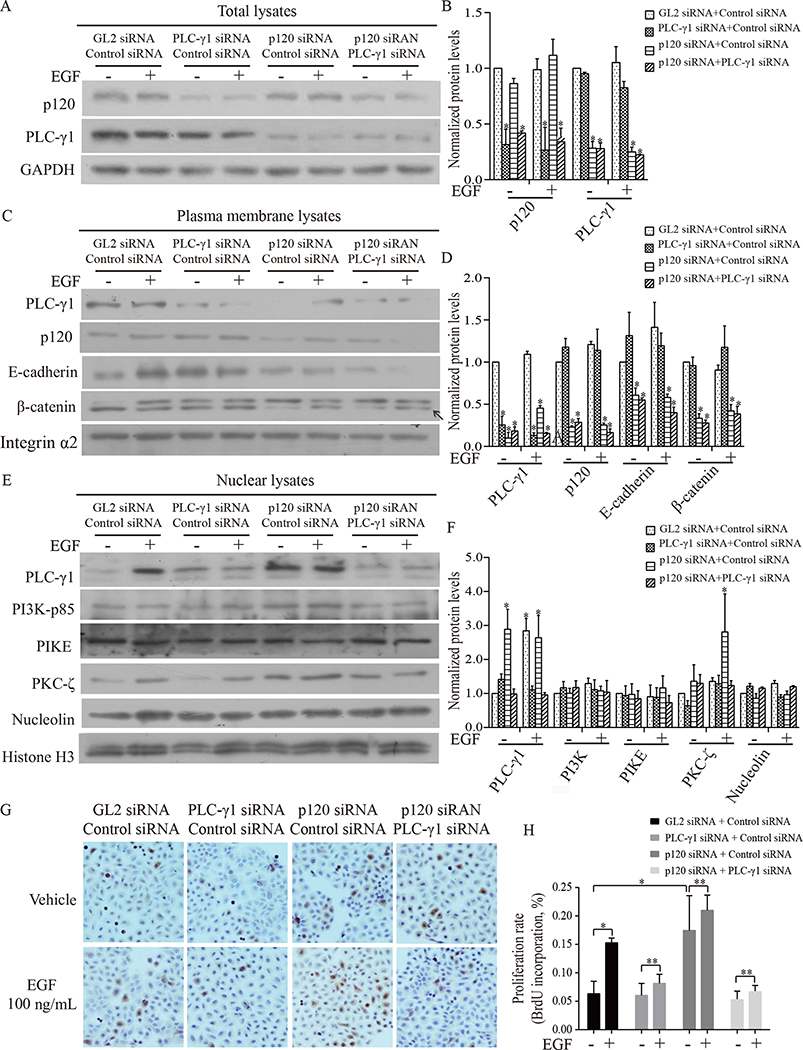
Figure 3. p120 knockdown potentiated EGF-induced PLC-γ1 signaling in the nucleus leading to proliferation of Tca-8113 cells and this potentiation was blocked by PLC-γ1 knockdown.
Tca-8113 cells were treated with four groups of siRNAs (GL2 siRNA + control siRNA, PLC-γ1 siRNA + control siRNA, p120 siRNA + control siRNA, or p120 siRNA + PLC-γ1 siRNA), and then treated with vehicle or EGF for 7 minutes. Cells were harvested, total cell lysates, plasma membrane lysates and nuclear lysates were isolated (A-F). Panel A shows the effect of PLC-γ1, or p120, or both p120 and PLC-γ1 knockdown on EGF-induced expression of p120 and PLC-γ1 in total cell lysates. Panel C shows the effect of PLC-γ1, or p120, or both p120 and PLC-γ1 knockdown on EGF-induced expression of p120 and PLC-γ1 in plasma membrane lysates. Panel E shows the effect of PLC-γ1, or p120, or both p120 and PLC-γ1 knockdown on EGF-induced expression of PLC-γ1, PI3K, PIKE, PKC-ζ and nucleolin in nuclear lysates. The protein signal intensities were quantitated by Image Pro Plus Software and normalized to band intensities of β-actin or integrin-α2 or histone H3. Results are expressed as percentages of the values in the control lane (the presence of GL2 siRNA + control siRNA treated with vehicle), as shown in panel B, D F. Data expressed is from three independent experiments. Panel G, H shows results of cell proliferation. Tca-8113 cells were treated with the four groups of siRNAs and then with vehicle or EGF for 24 hours. Cells were harvested and total cell lysates were isolated. Levels of p120, PLC-γ1 and β-actin were determined by Western analysis (data not shown). In parallel experiments, cell proliferation was determined by BrdU incorporation assay (immuocytochemistry, G). BrdU positive expression is shown in brown in the nuclei and the counterstaining is shown in blue. The staining on representative sections is shown. Quantitation of the staining is presented as bar graphs (H). The quantitation of positive expression in each section was obtained by Image Pro Plus software. Comparison between the groups of tumors was performed using Mann-Whitney U test. The data are expressed as mean± SD. The experiment was done in triplicates and repeated three times. Statistical significances (* p < 0.05, compared with the group treated with GL2 siRNA + control siRNA with vehicle or EGF treatment) are indicated.

