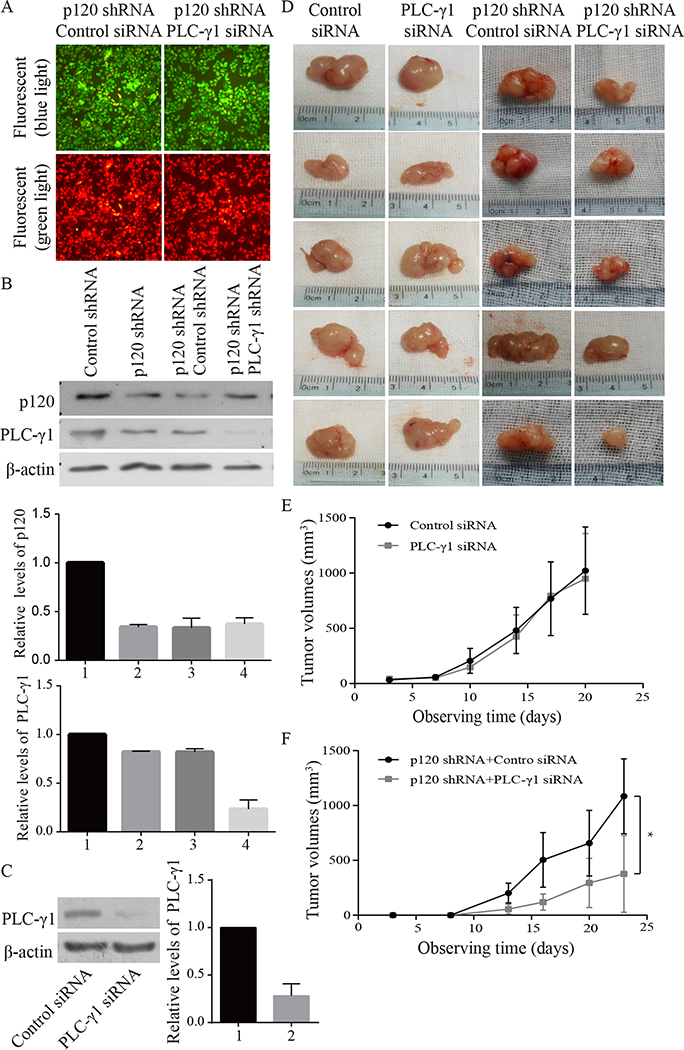
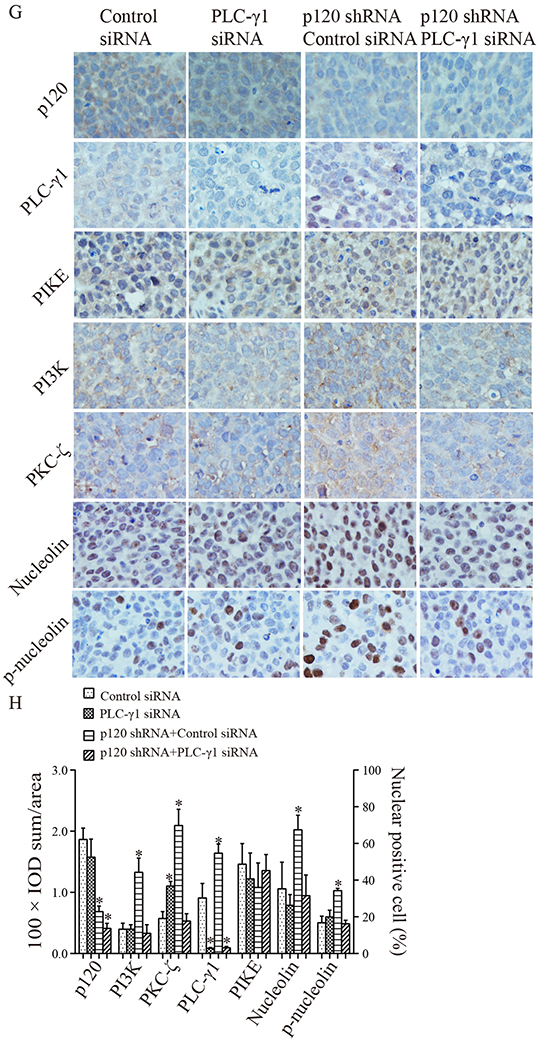
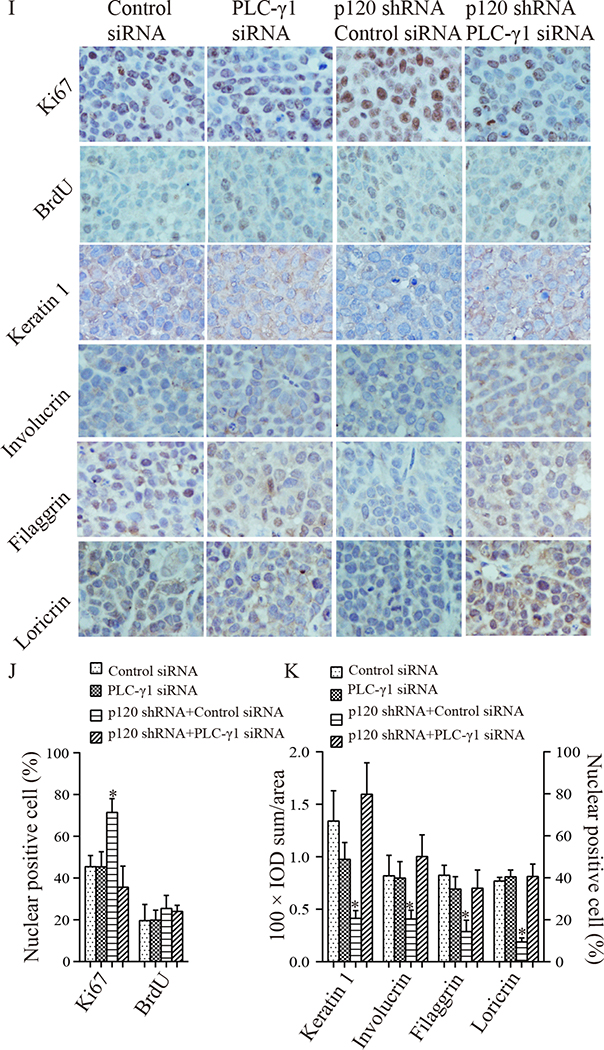
Figure 5. PLC-γ1 knockdown blocked increased PLC-γ1 signaling in the nucleus and proliferation of Tca-8113 cells induced by p120 knockdown in vivo.
Tca-8113 cells with stable knockdown of p120 (p120 shRNA cells) were treated with PLC-γ1 or control shRNA plasmids containing RFP and hygromycin B resistant elements, and then cultured in medium with hygromycin B. The cells with p120 shRNA + control shRNA or p120 shRNA + PLC-γ1shRNA were hygromycin B resistant and emitted green fluorescence under blue light and green fluorescence under green light (A). The expression levels of p120 and PLC-γ1 in these selected cells were evaluated by Western blot (B). Panel C shows the knockdown efficiency of PLC-γ1 siRNA in Tca-8113 cells. The protein signal intensities were quantitated by Image Pro Plus Software and normalized to band intensities of β-actin. Results are expressed as percentages of the values in the control lane (the presence of control shRNA or control siRNA), as shown in bar graphs in panel B and C. B: 1. Control shRNA, 2. p120 shRNA, 3. p120 shRNA + Control shRNA, 4. p120 shRNA + PLC-γ1 shRNA. C: 1. Control siRNA, 2. PLC-γ1 siRNA. Data expressed is from three independent experiments. Panel D shows representative images of xenograft tumors. Tca-8113 cells were injected subcutaneously into bilateral flanks of 5 nude mice. When tumors became palpable, intra-tumor delivery of PLC-γ1 siRNA or control siRNA was administered twice a week to each flankof tumors (the left two columns). Another group of mice (n=5) was injected with Tca-8113 cells with stable knockdown of p120 or knockdown of both p120 and PLC-γ1 to each flank of mice (p120 shRNA + control shRNA cells or p120 shRNA + PLC-γ1 shRNA cells, the right two columns). The growth rate of tumors was recorded twice a week. Panel E is the volume growth curve of tumors treated with PLC-γ1 siRNA or control siRNA. Panel F is the volume growth curve of tumors derived from p120 shRNA + control shRNA cells or p120 shRNA + PLC-γ1 shRNA cells. Comparisons of tumors’ volumes in each group were made for statistical difference (* p <0.05) by the paired t-test. 3 weeks later, the mice were sacrificed and the four groups of tumors were removed. Tumor tissue sections were stained with antibodies against p120 and PLC-γ1 signaling molecules (G, PLC-γ1, PI3K p85, PIKE, PKC-ζ, nucleolin and p-nucleolin), proliferation markers (I, Ki67 and BrdU) and differentiation markers (I, keratin 1, involucrin, filaggrin and loricrin). Positive expression is shown in brown and the counterstaining is shown in blue. The staining on representative sections is shown. Quantitation of the staining is presented as bar graphs (H, J, K). The quantitation of positive expression in each section was performed by Image Pro Plus software. The differences between the groups of tumors wereanalyzed by Mann-Whitney U test. The data are expressed as mean± SD, * p <0.05 (compared with tumors treated with control siRNA).


