
Extended Data Figure 5. Phytate digestion promotes HDAC activity in IECs.
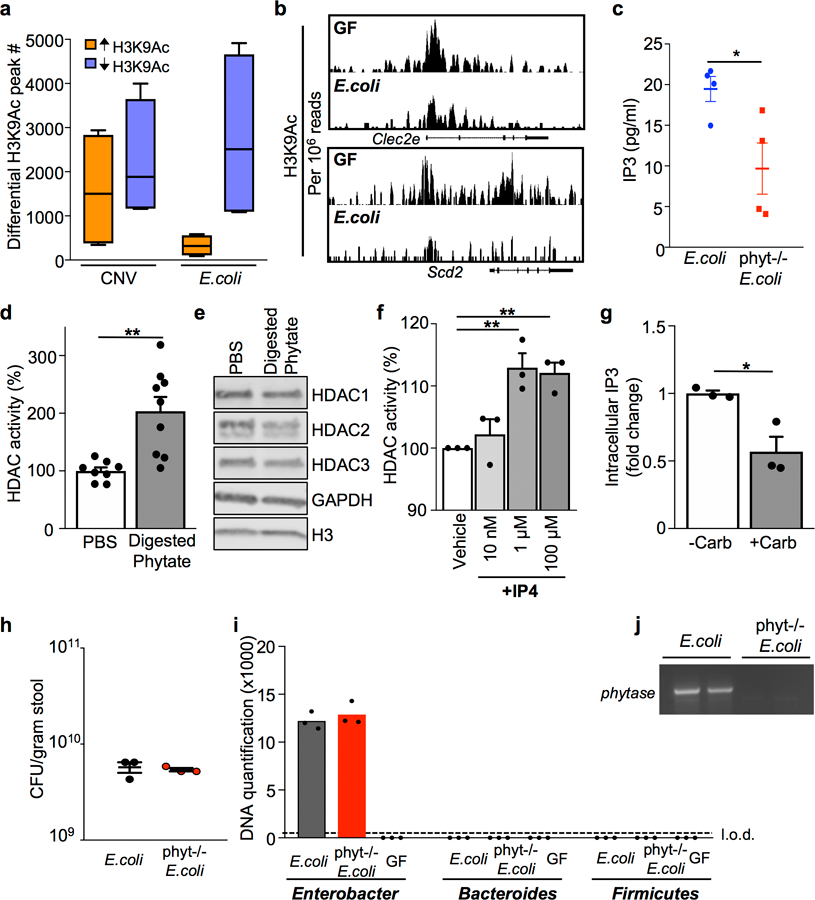
(a) Number of peaks identified by ChIP-sequencing with significantly increased or decreased H3K9Ac enrichment in IECs, relative to IECs harvested from GF mice. n=2/group; Min to max plots for each comparison (4 per bar); line at median. (b) ChIP-seq for H3K9Ac at HDAC3 target genes in primary IECs isolated from GF and E. coli mono-associated mice. Peaks are normalized to reads per million mapped reads. (c) IP3 levels in 1010 colony forming units (CFU)/ml cultures of phytase−/− E. coli (n=4) versus wildtype E. coli (n=4) *p= 0.0314. (d) HDAC activity of mouse colonoids treated with PBS (n=8) or phytase-digested phytate (1mg/ml) (n=9) for 5 hours.**p= 0.0016. (e) Western blot detection of HDACs in mouse colonoid lysate. For gel source data, see Supplementary Fig. 1. (f) HDAC activity with inositol-1,4,5,6-tetrakisphosphate (IP4) doses as indicated. n=3/group. **p=0.0052 (1μM), **p=0.0018 (100μM). (g) Relative intracellular IP3 levels of colonoids treated with phytase-digested phytate (1mg/ml) −/+ 40 μM carbenoxolone. n=3/treatment. *p=0.0189. (h) CFU measured in stool collected from mice mono-associated with E. coli or phytase−/− E. coli. n=3/group. (i) Bacterial-specific qPCR of feces for Enterobacteriaceae, Bacteroides, and Firmicutes. n=3/group. (j) PCR of E. coli phytase gene (appA1) in stool from mono-associated mice in (h, i). All graphs, except (a), are mean of biologic replicates ± s.e.m.; unpaired two-tailed t test. Data were independently repeated two (e, f) or three (c, d, g-j) times with similar results. *p ≤ 0.05, **p ≤ 0.01.