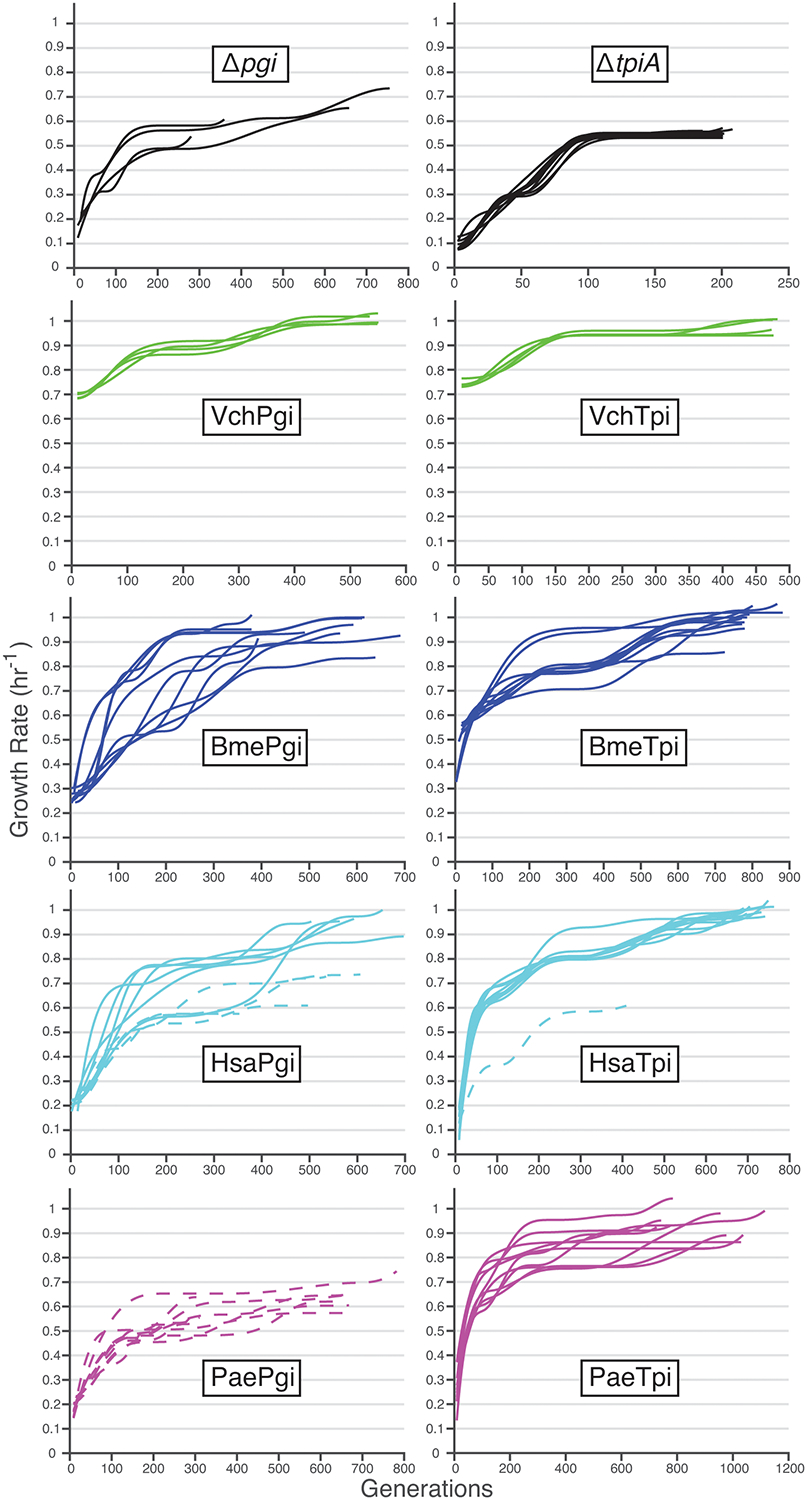
Extended Data Fig. 2. Evolutionary trajectories.

Fitness improvements over the course of evolution for knockout controls and gene-swapped strains, with failure lineages indicated by dotted lines. ΔtpiA controls were increased from four to ten to provide more comparison lineages for the single HsaTpi failure.
