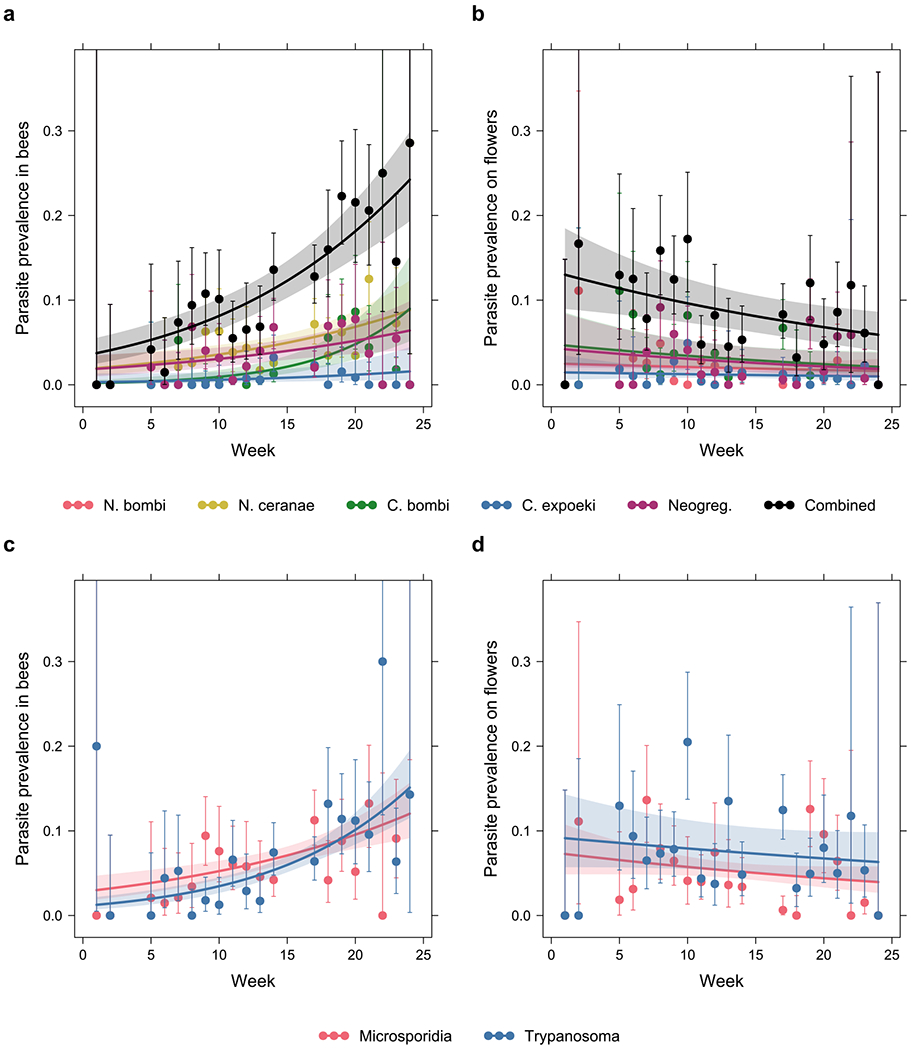
Fig. 2 |. Parasite prevalence increased throughout the season in the bee community while it decreased or remained constant in the floral community.

Prevalence of the specific parasite species or groups (Nosema bombi, N. ceranae, Crithidia bombi, C. expoeki, and neogregarines) in a, the bee community, and b, the floral community. Prevalence of the broad groups (microsporidians, trypanosomatids) in c, the bee community, and d, the floral community. The x-axis corresponds to week number in the field season (week 1 starting April 18, week 24 ending September 22). Error bars are 95% Clopper-Pearson confidence intervals. To reduce plot clutter, points and error bars are based on pooled data from all three sites each week; however, statistical tests and the prediction curves and confidence bands are based on GLMMs with site as a random factor.
