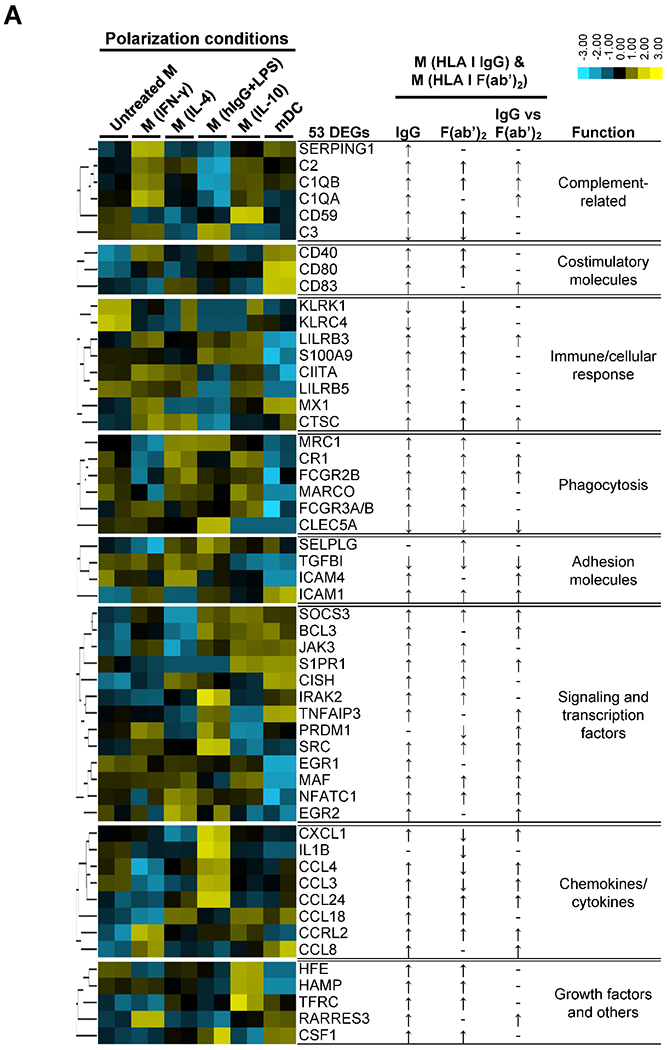
Fig. 7.


HLA I antibody-polarized macrophages exhibit a unique transcriptional profile. (A) Heat map shows expression of the 53 DEGs in macrophages from two independent experiments using 2 monocyte donors polarized using canonical stimuli compared to expression of DEGs in M(HLA I IgG) and M(HLA I F(ab’)2) obtained by testing two monocyte donors against 3 ECs. ↑, ↓, and – indicate up-regulated, down-regulated and unchanged, respectively, refering to the data in Table 1. (B) Hierarchical clustering was used to compare the pattern of gene expression between the control cultures, M(HLA I IgG) and M(HLA I F(ab’)2). (C) For macrophages polarized using canonical stimuli DEGs were defined as an absolute fold change > 1.5. The radar chart shows the difference in the numbers of DEGs shared with between M(HLA I IgG) and M(HLA I F(ab’)2 and M(IL-4) and M(IL-10).
