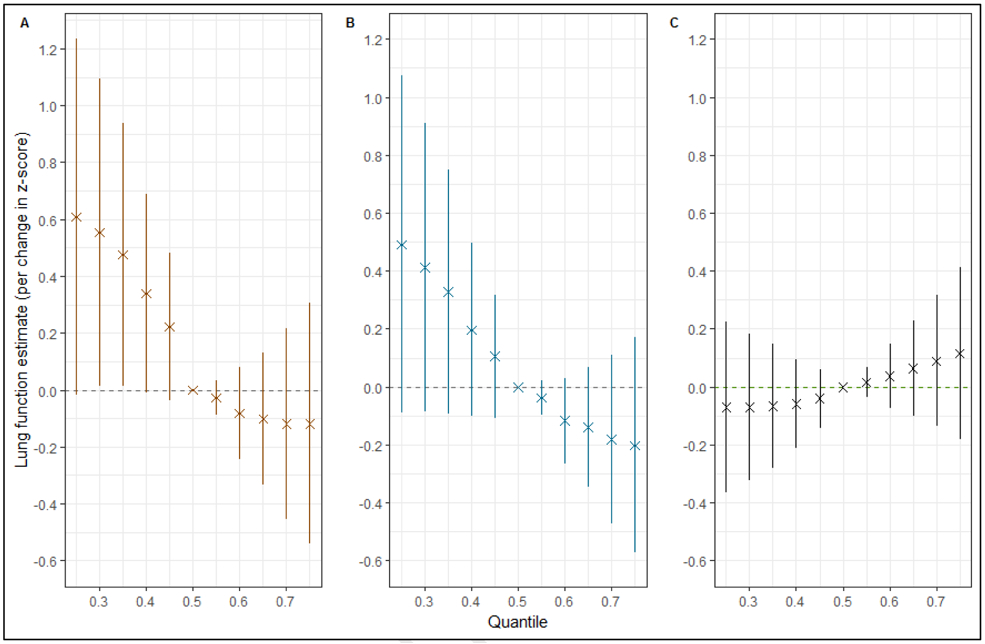
Figure 3. Overall effect (95% CI) of mixtures on the 3 outcome measures.

Figures depict the effect on lung function outcomes (A. forced expiratory volume in 1s (FEV1); B. forced vital capacity (FVC); and C. forced expiratory flow between 25% and 75% of vital capacity (FEF25-75)) when all the environmental exposures (ozone, nitrogen dioxide, particulate matter with median aerodynamic diameter < 2.5 μm, and < 10μm, organophosphates, carbamates and methyl bromide) at particular percentiles were compared to all the exposures at their 50th percentile.
The models were adjusted for age, height, sex, race/ethnicity, temperature, precipitation, season, BMI, maternal education level, household income, insurance status, atopy, a measure of asthma severity (based on Global Initiative for Asthma symptom severity guidelines), smoker currently in home, and proximity to a major roadway.
