
Figure 4.
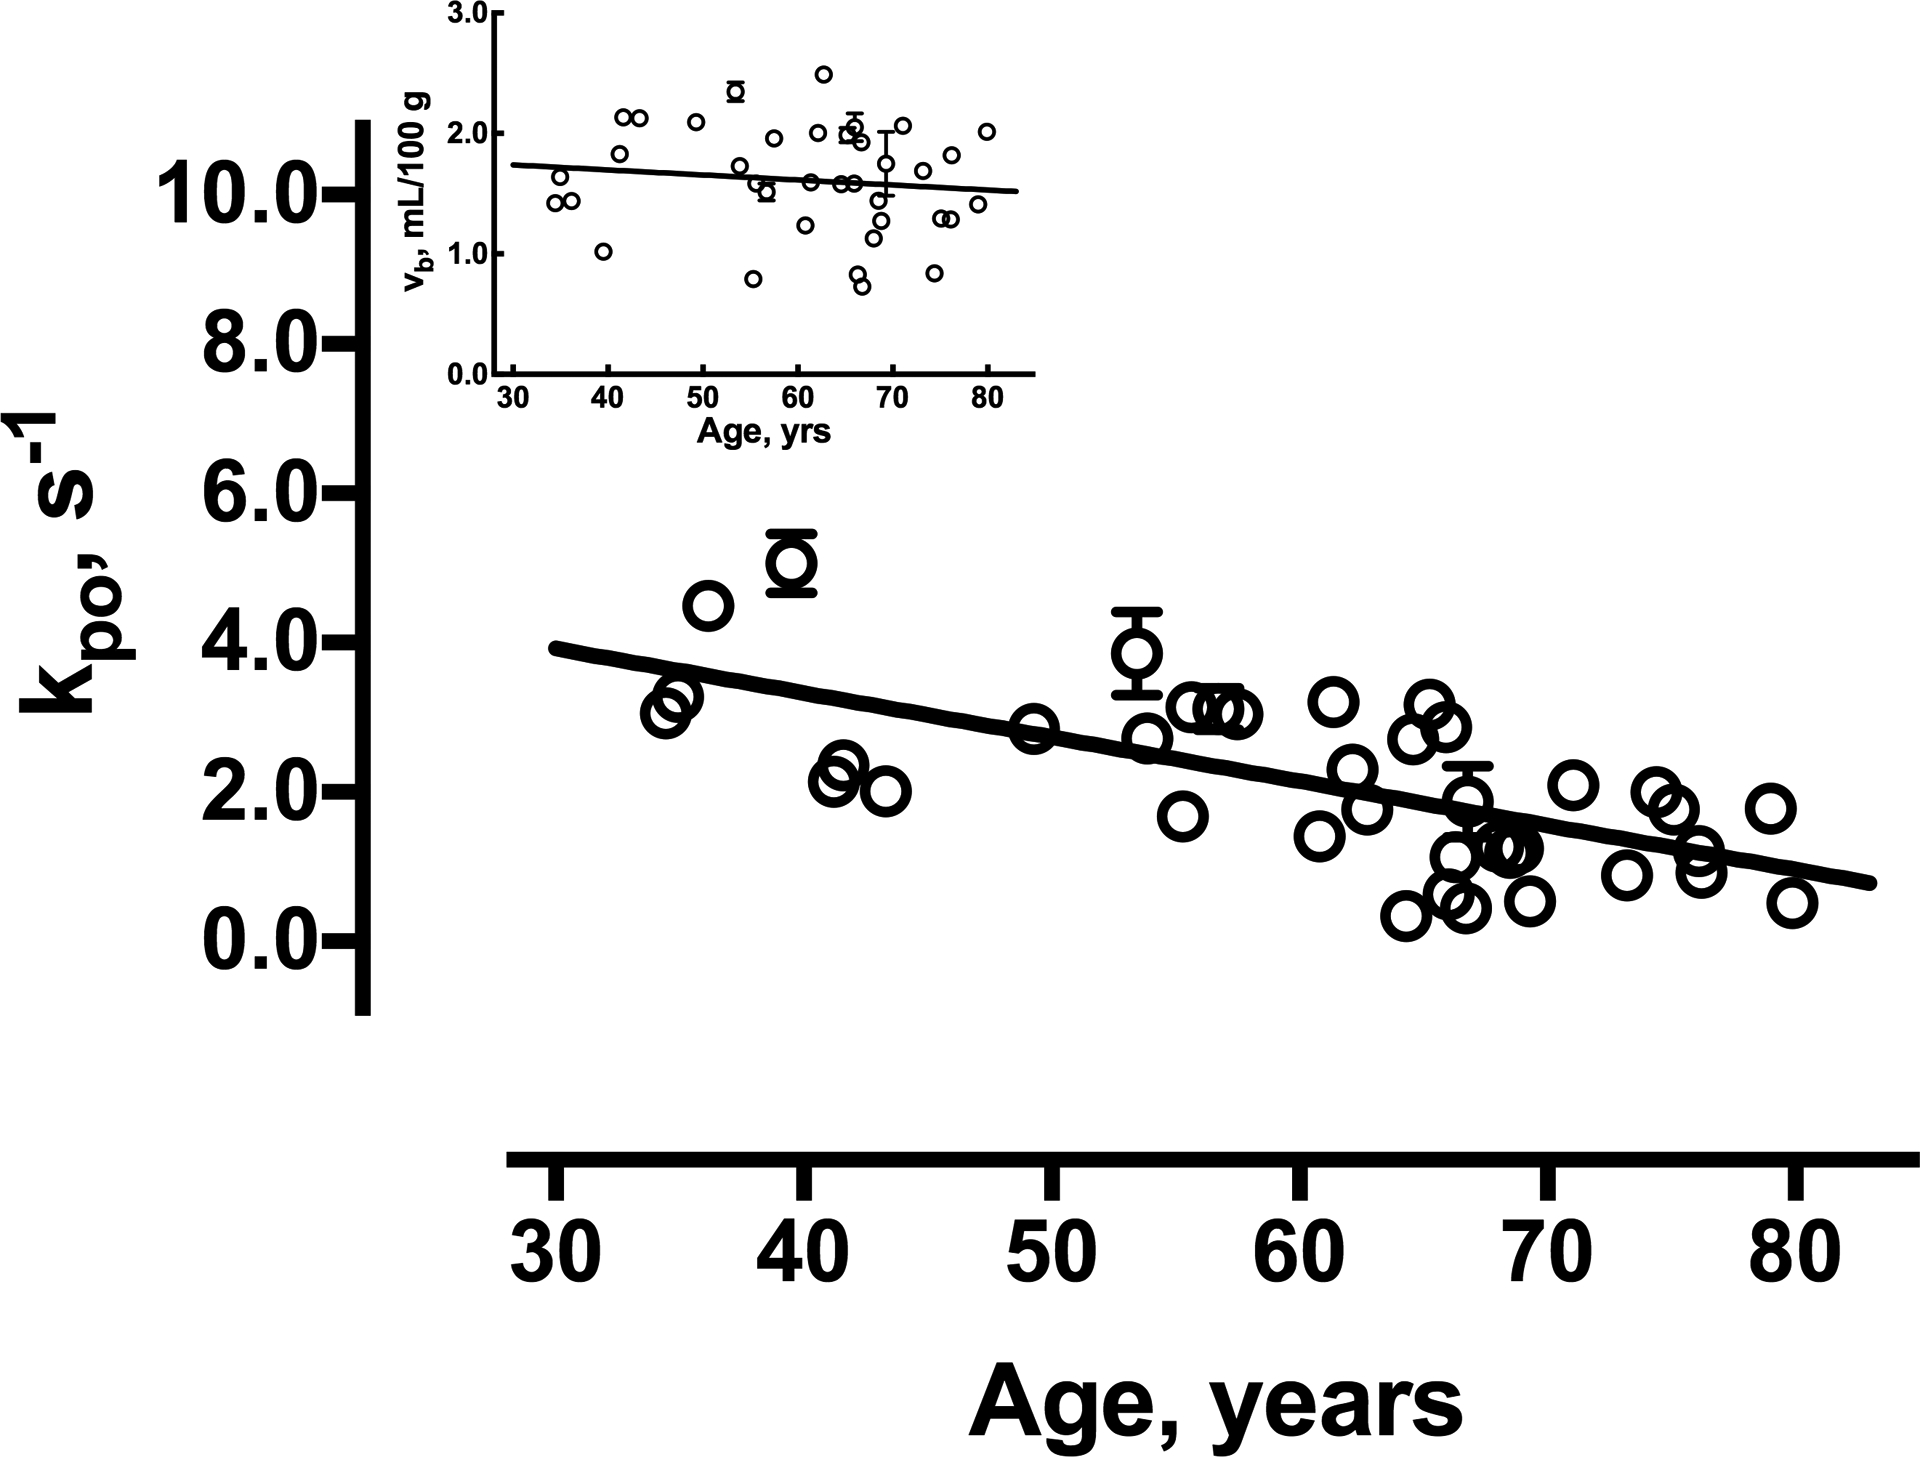
Linear regression plots of vb (inset) and kpo by age. The error bars (not all of which are visible on this scale) reflect standard deviation of ROI mean estimates for individual subjects based on Monte Carlo simulations. The solid lines represent the best linear fittings to the data.