
Extended Data Figure 9. Effect of extra gene copies on accumulation of TA pathway intermediates and products in scopolamine-producing strain CSY1296.
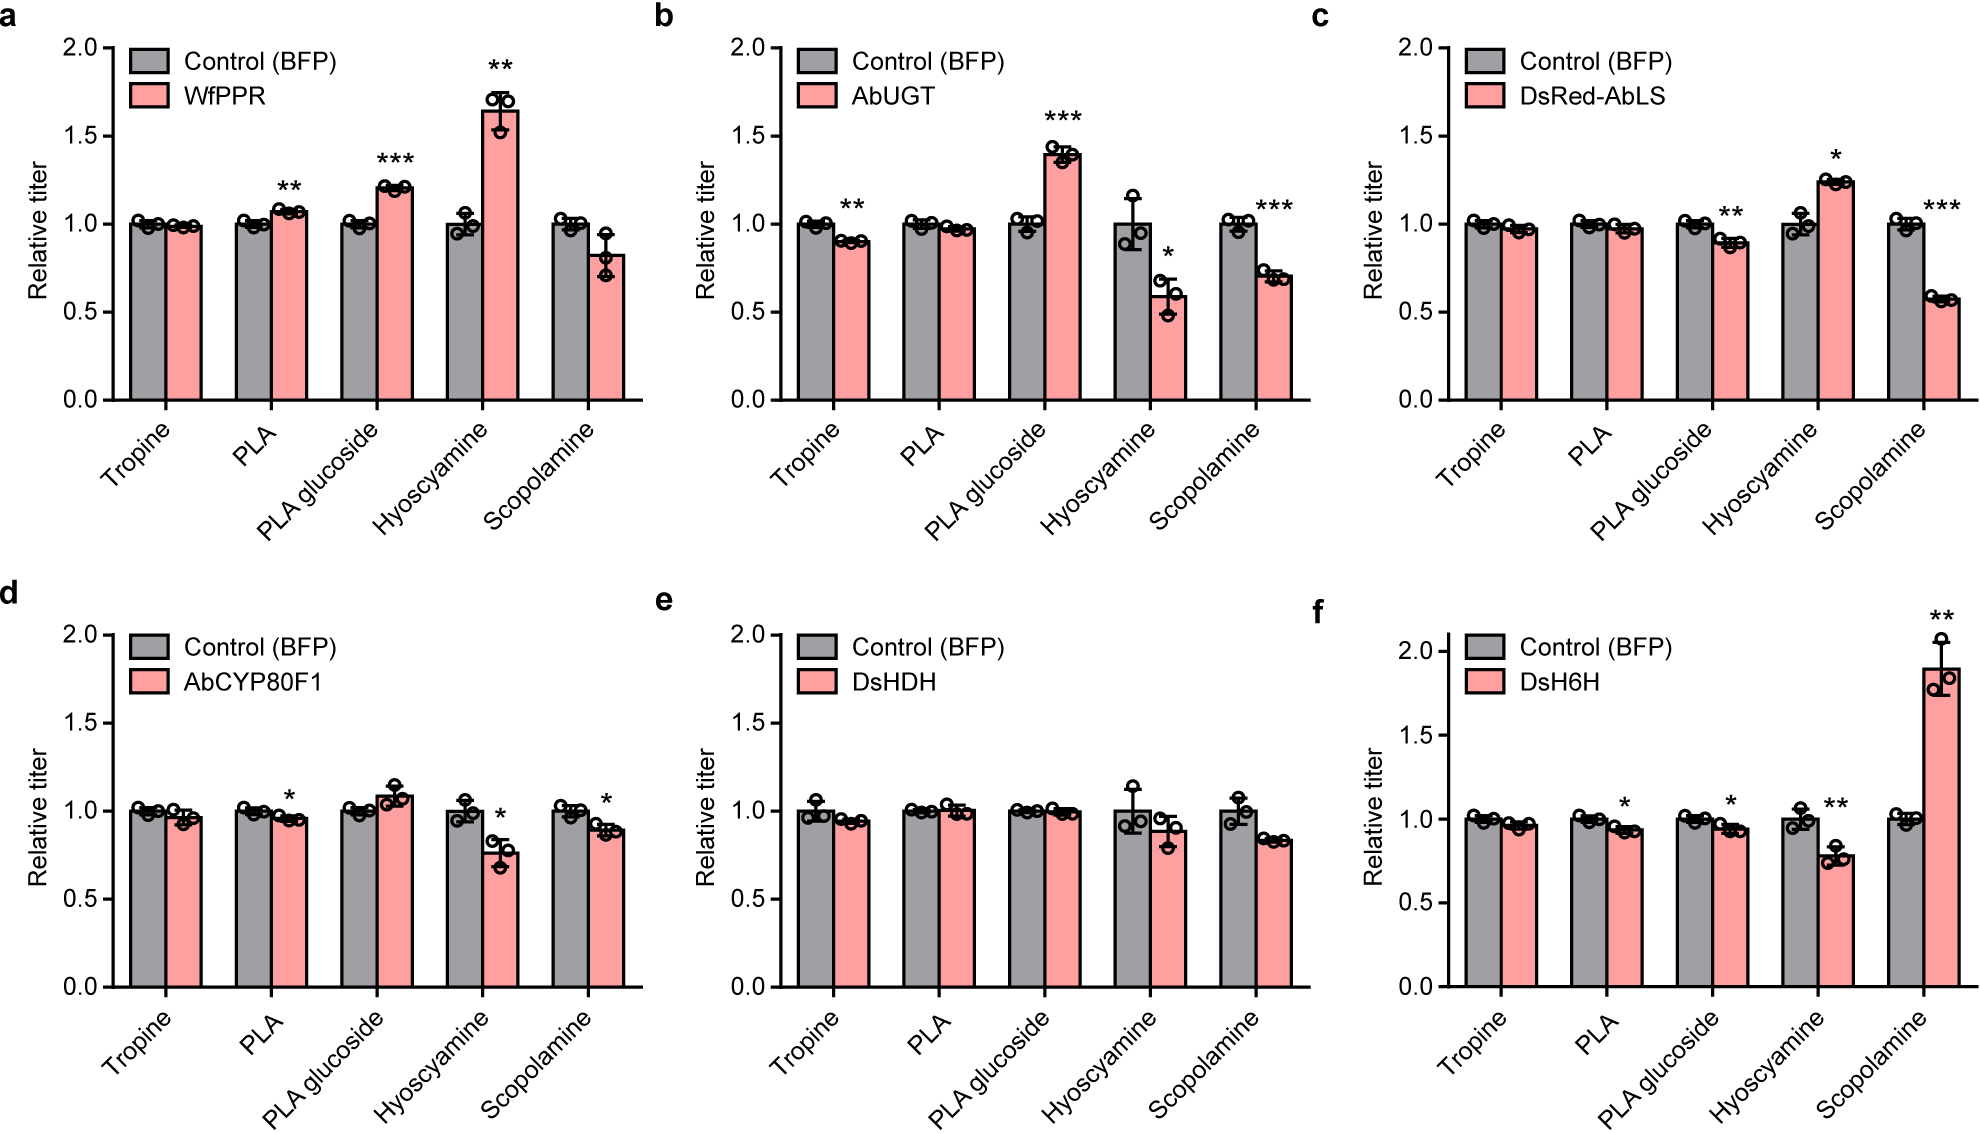
An additional copy of each biosynthetic enzyme between tropine and scopolamine was expressed from the following low-copy plasmids in strain CSY1296: (a) WfPPR, pCS4436; (b) AbUGT, pCS4440; (c) DsRed-AbLS, pCS4526; (d) AbCYP80F1, pCS4438; (e) DsHDH, pCS4478; (f) DsH6H, pCS4439; or a BFP control (pCS4208, pCS4212, or pCS4213). Transformed strains were cultured in appropriate selective media at 25 °C for 96 h prior to quantification of metabolites in the growth medium by LC-MS/MS analysis of culture supernatant. Note that no littorine accumulation was observed for any samples. Data indicate the mean of n = 3 biologically independent samples (open circles) and error bars show standard deviation. Metabolite titers are shown relative to the BFP control with the same auxotrophic marker as the biosynthetic gene: WfPPR (a), DsRed-AbLS (c), AbCYP80F1 (d), and DsH6H (f) relative to the pCS4213 control (LEU2); AbUGT (b) relative to the pCS4208 control (URA3); and DsHDH (e) relative to the pCS4212 control (TRP1). Student’s two-tailed t-test: *P < 0.05, **P < 0.01, ***P < 0.001. Statistical significance is shown relative to corresponding controls. Exact P-values: (a) PLA, 0.00950; PLA glucoside, 3.36 × 10⁻⁴; hyoscyamine, 0.00221; (b) tropine, 0.00500; PLA glucoside, 3.59 × 10⁻⁴; hyoscyamine, 0.0192; scopolamine, 6.90 × 10⁻⁴; (c) PLA glucoside, 0.00544; hyoscyamine, 0.0165; scopolamine, 3.43 × 10⁻⁴; (d) PLA, 0.0487; hyoscyamine, 0.0154; scopolamine, 0.0159; (f) PLA, 0.0153; PLA glucoside, 0.0453; hyoscyamine, 0.00958; scopolamine, 0.00816.