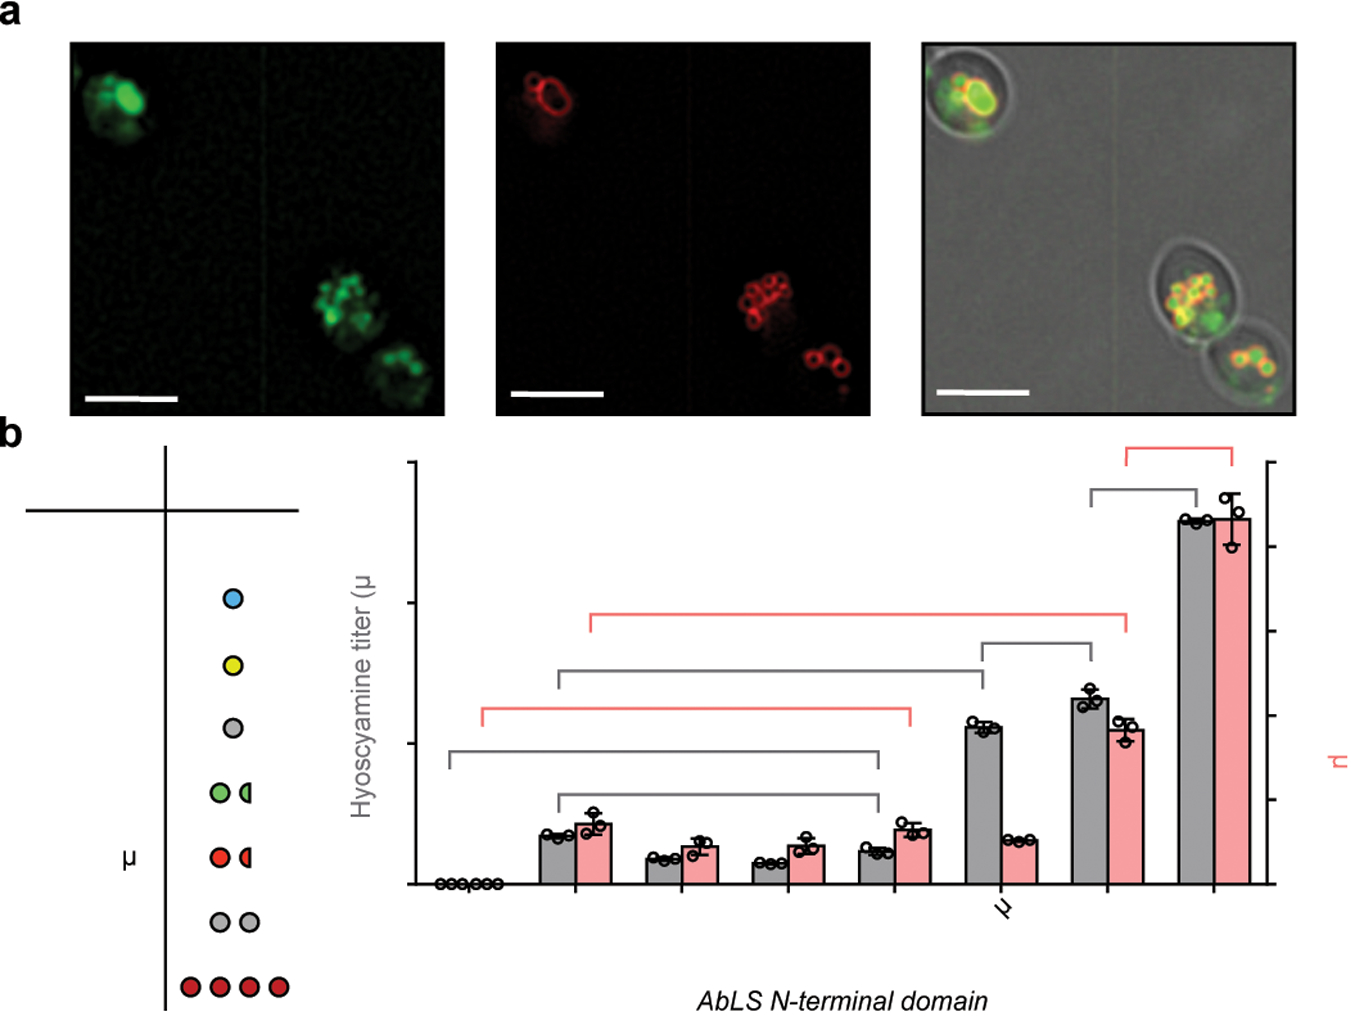
Figure 3. Engineering littorine synthase for activity in yeast.

(a) Yeast epifluorescence microscopy showing N-terminal GFP-tagged AbLS (GFP-AbLS), vacuolar membrane stain FM4–64, and brightfield merged images. Microscopy was performed on CSY1294 expressing GFP-AbLS from a low-copy plasmid. 2D deconvolution was performed as described in Online Methods. Scale bar, 5 μm. Images are representative of two independent experiments. (b) De novo hyoscyamine and scopolamine production in engineered yeast expressing AbLS N-terminal fusions. Table shows expected oligomerization state of each N-terminal domain. Wild-type (control) or AbLS fusions were expressed from low-copy plasmids in CSY1294. Transformed strains were cultured for 96 h prior to LC-MS/MS analysis of metabolites in culture supernatant. No littorine was detected, indicating complete conversion to downstream TAs. Data represent the mean of n = 3 biologically independent samples (open circles), error bars show standard deviation. Student’s two-tailed t-test: *P < 0.05, **P < 0.01, ***P < 0.001. Exact P-values are in Supplementary Table 5.
