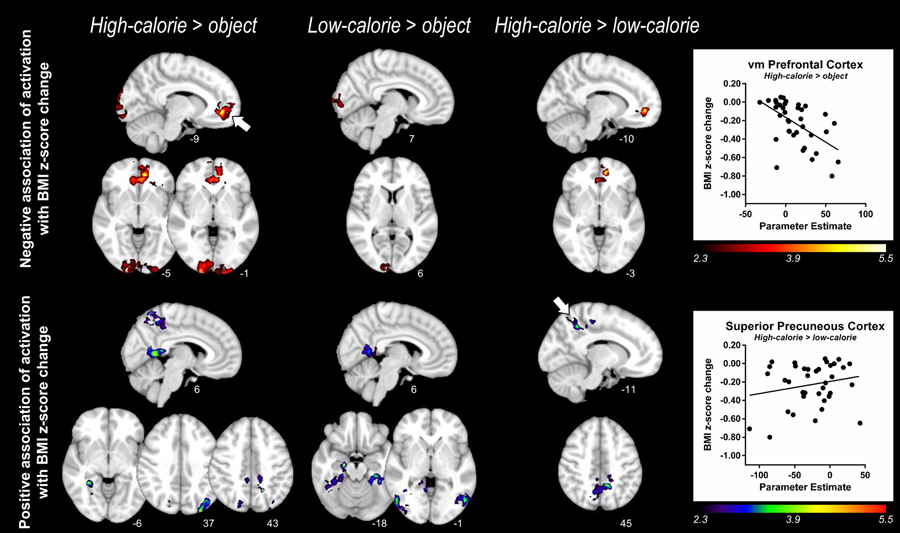
Figure 3.
Whole-brain cluster analyses of pre-meal brain activation in association with change in BMI z-score by FBT. The top panel shows significant clusters of activation prior to the standardized meal in which increased activation to high-calorie foods (vs. objects (left); vs. low-calorie foods (right)) and low-calorie foods (vs. objects (center)) is associated with greater BMI z-score reductions by FBT. Scatter plot in top panel represents mean parameter estimates of activation derived from the significant cluster in the ventromedial prefrontal cortex (vm PFC) region shown in top left panel (indicated by arrow, High-calorie > object) versus BMI z-score change by FBT. The bottom panel shows significant clusters of activation (pre-meal) in which increased activation to high-calorie (vs. objects (left); vs. low-calorie foods (right)) and low-calorie foods (vs. objects (center)) is associated with little or no change in BMI z-score by FBT. Scatter plot in bottom panel represents mean parameter estimates of activation derived from the significant cluster in the superior precuneous cortex region shown in bottom right panel (indicated by arrow, high-calorie > low-calorie) versus BMI z-score change by FBT. Z statistic maps were whole-brain corrected for multiple comparisons using a cluster threshold correction with the individual voxel threshold at Z = 2.3 and a corrected cluster significant threshold of P < 0.05. Color scales provided Z values of functional activation and numbers below each brain image are Montreal Neurological Institute coordinates. N=37 children with obesity. See Table 3 for further details of the cluster statistics.

