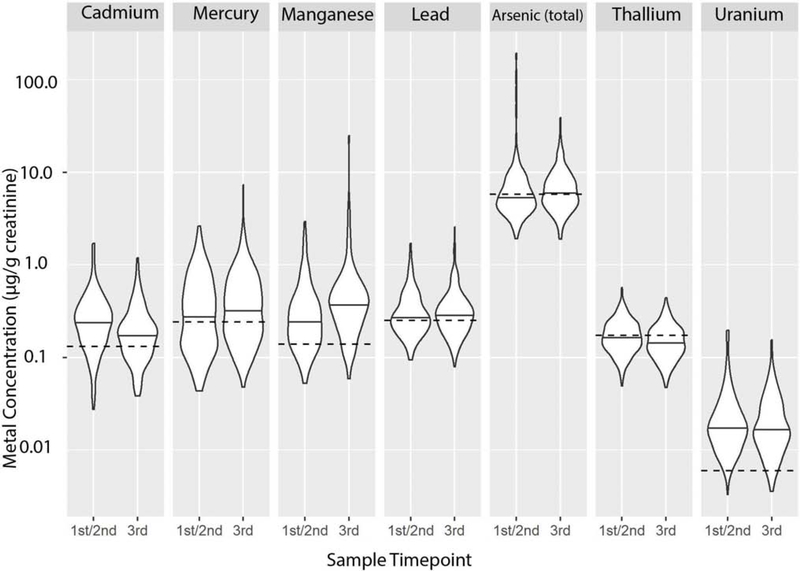
Figure 3.
Bean plot illustrating the distribution and median concentration for urine creatinine-corrected metal concentrations, stratified by enrollment (during 1st or 2nd trimester) and delivery (collected after 36 weeks gestational age or when a pregnant mother was admitted to the hospital for labor). Reference population (NHANES) median concentrations are plotted as a dashed line for each metal.

