Fig. 3.

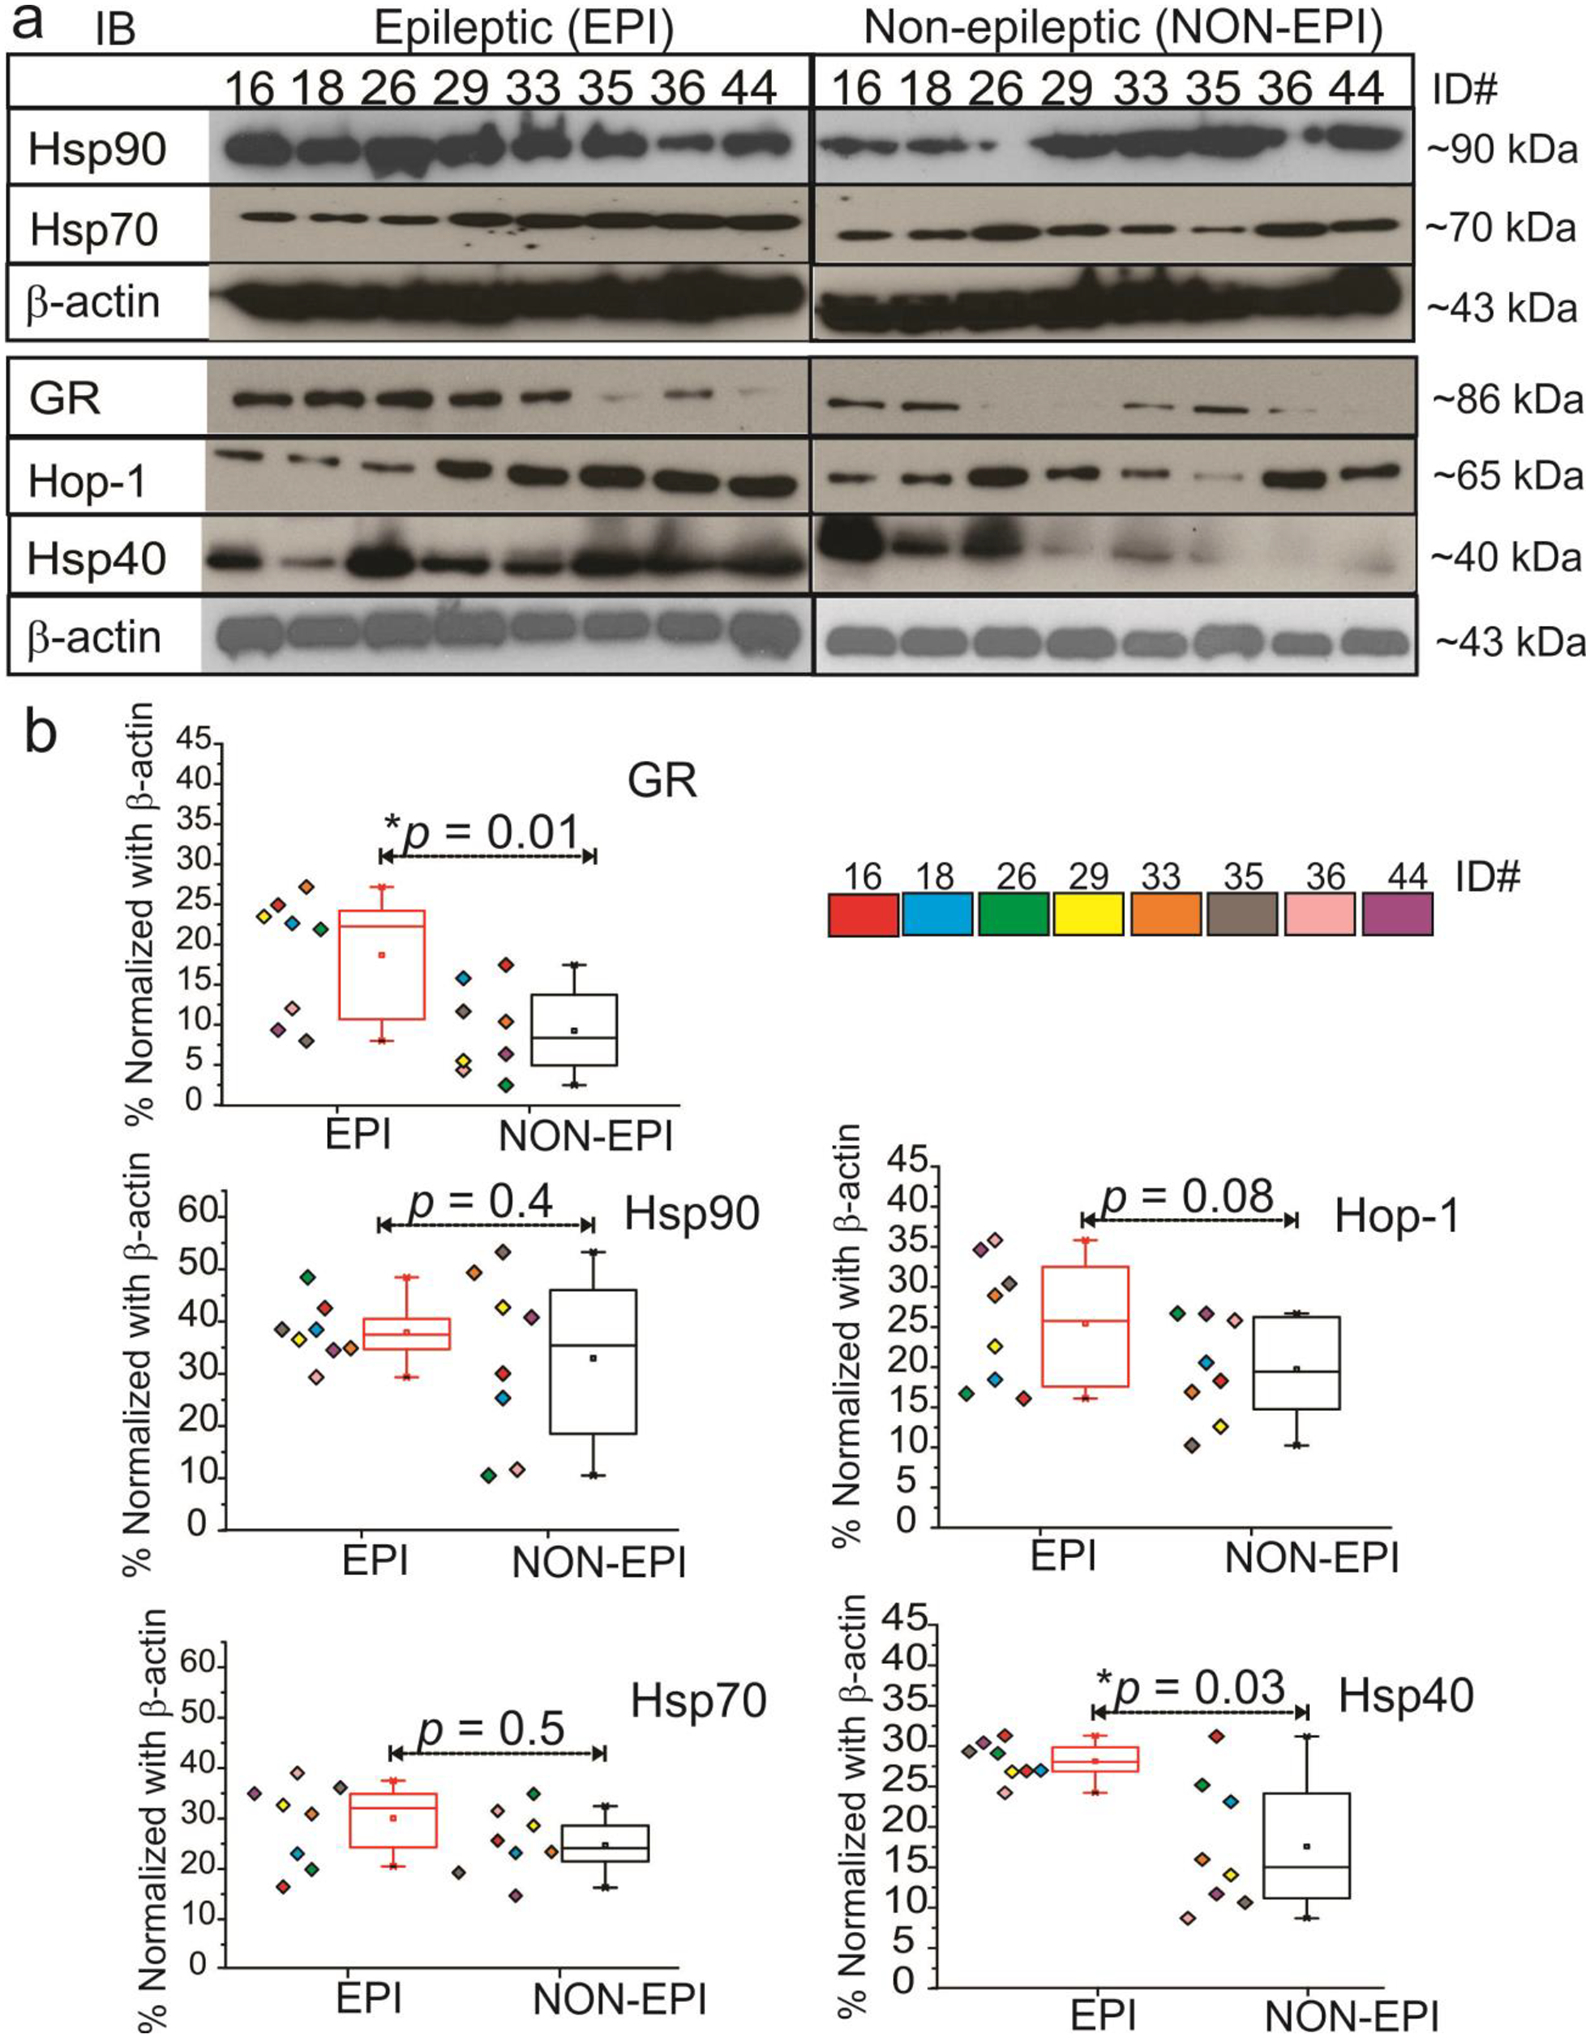
GR-Hsp and Hop expression pattern in EPI and NON-EPI brain tissue regions (a, b). Western blot or immunoblot (IB) showed a significant increase in GR (**p < 0.01) expression and Hsp40 (*p < 0.03) in EPI vs. NON-EPI; however, Hsp90, Hsp70, and Hop-1 expression showed non-significant alterations (n = 8 subjects, color-coded, #ID, 16,18,26,29,33,35,36,44; EPI and NON-EPI) although a trend toward an increased level is evident among the subjects, as shown in the quantification (b). Results are expressed as mean ± SEM; *p < 0.05. ANOVA, analysis of variance.
