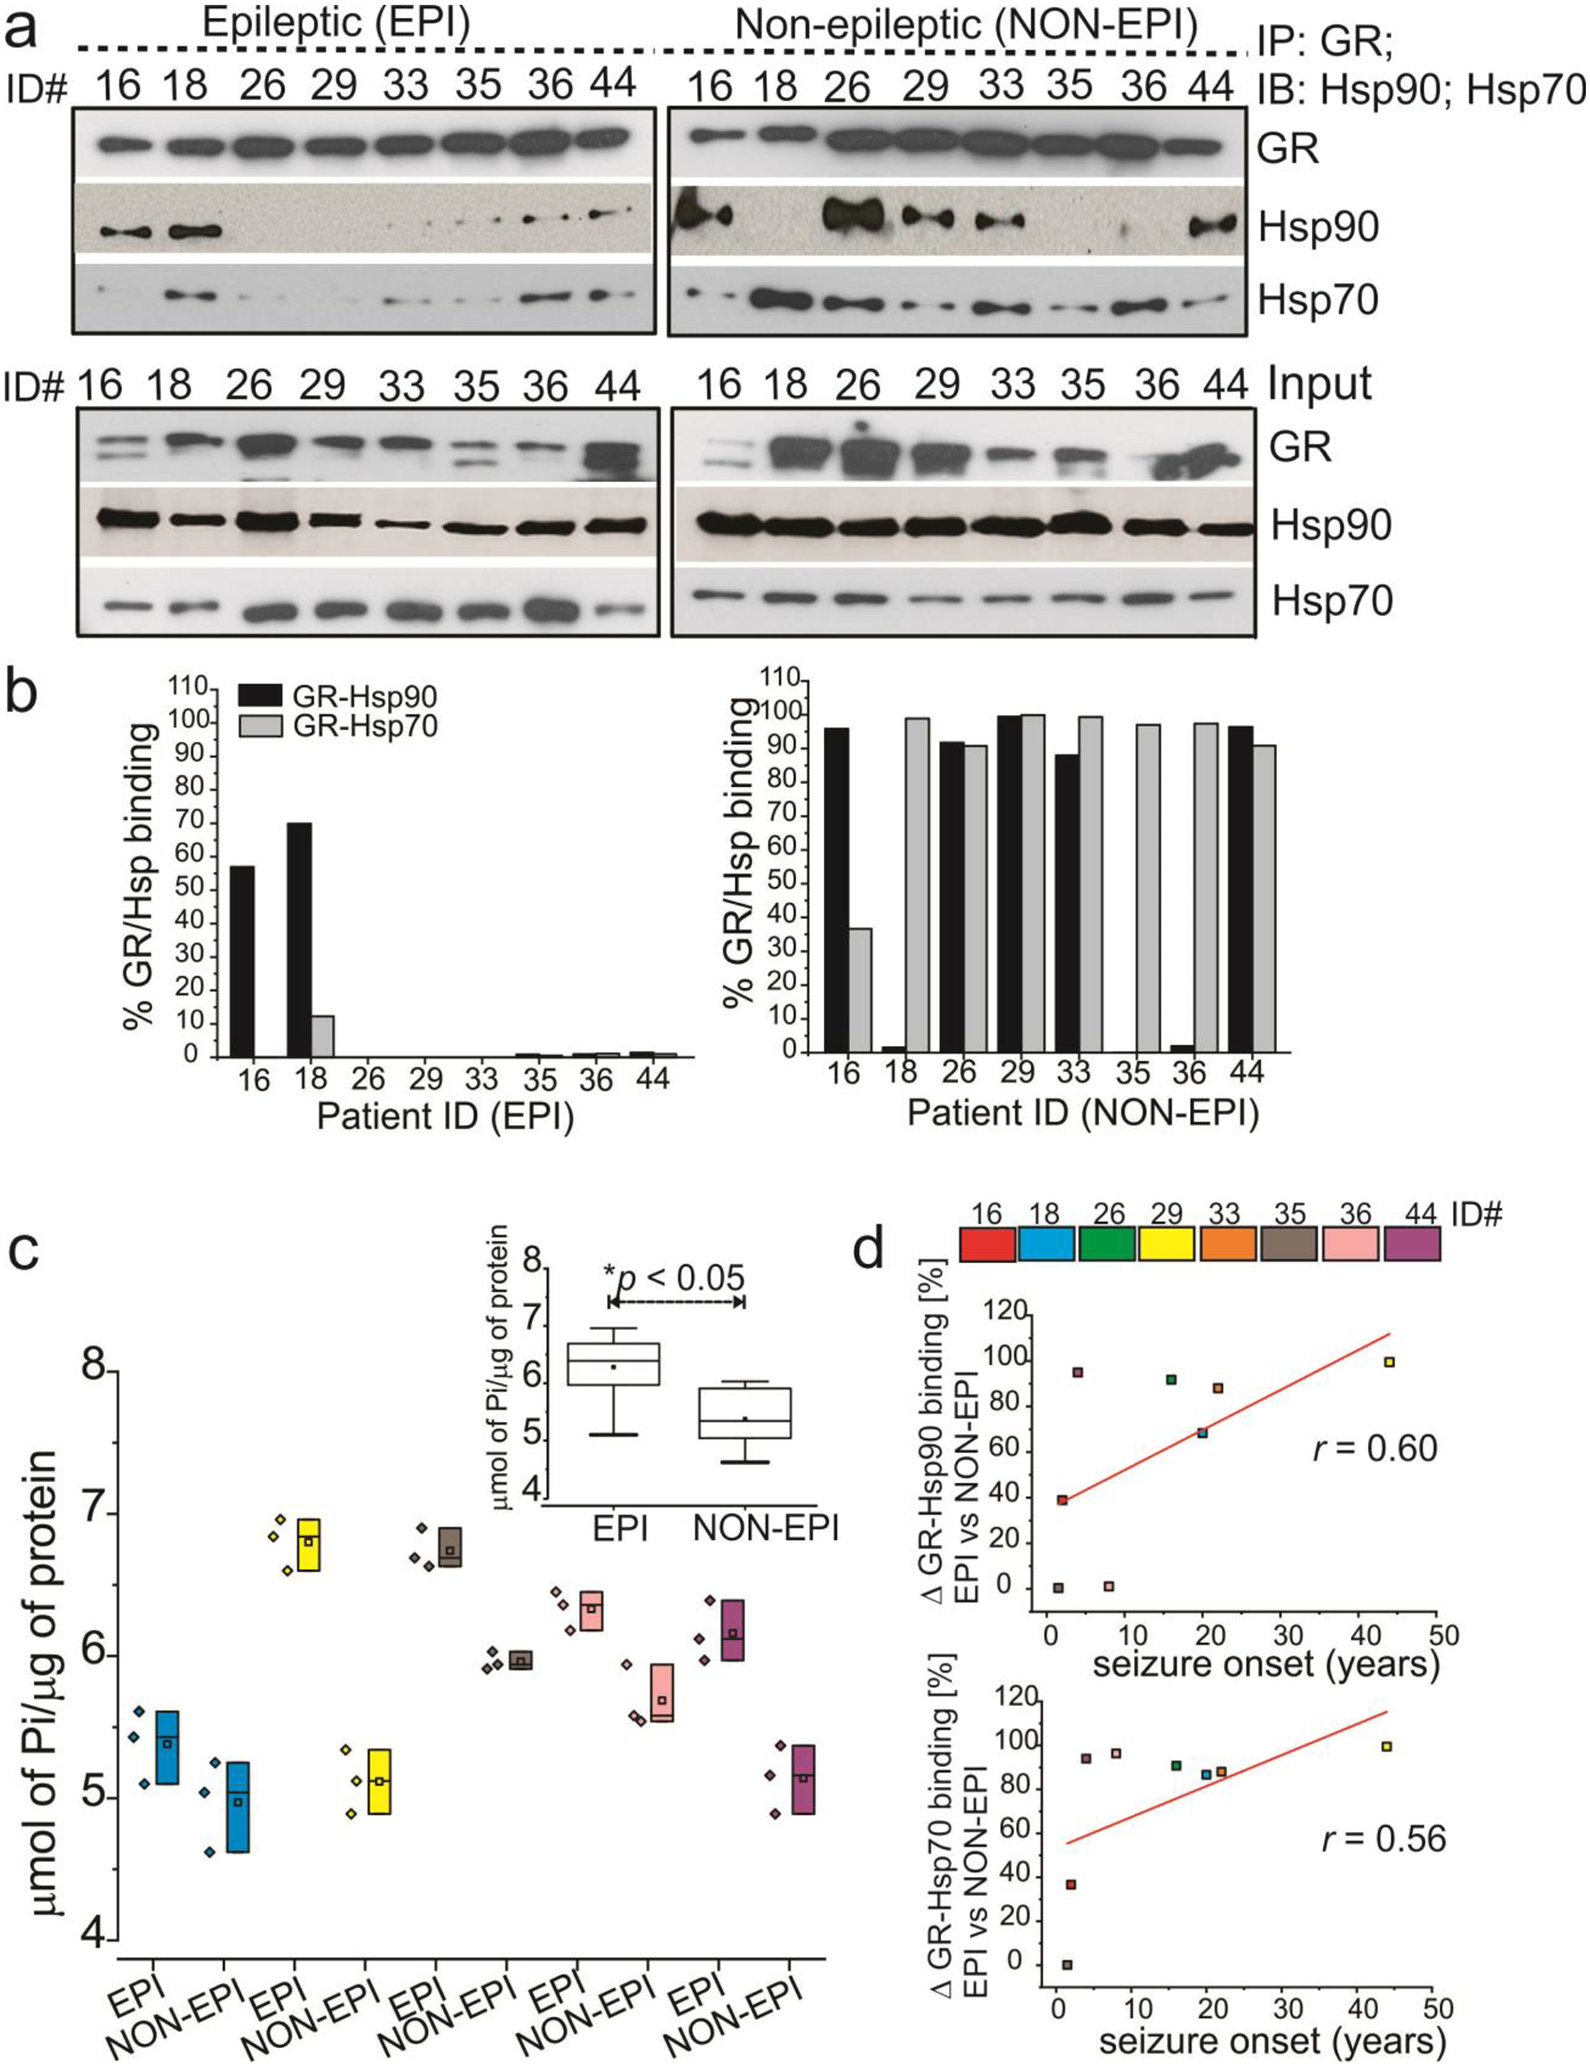
Fig. 4.

Immunoprecipitations (IPs) depicting GR-Hsp90/Hsp70 interactions on brain tissue. (a) The interaction of GR-Hsp90 and GR-Hsp70 is variable across epileptic (EPI) and non-epileptic (NON-EPI) brain regions (n = 8 subjects, color-coded, #ID, 16, 18, 26, 29, 33, 35, 36, 44; evaluated), but the overall low GR-Hsp90/Hsp70 binding pattern in the EPI suggests faster GR maturation. The lanes marked as Input indicate that 1 ⁄5th of total extract was loaded and analyzed by immunoblot (IB) for GR and Hsp90/Hsp70. (b) GR-Hsp90/Hsp70 binding percentages have been plotted, depicting the difference in GR-Hsp90/Hsp70 interactions in the EPI vs NON-EPI regions. (c) Enhanced focal ATPase activity and accelerated GR-Hsp maturation machinery in EPI compared to NON-EPI region is evident. Individually inorganic phosphate levels of each subject (n = 5) in EPI vs. NON-EPI tissue are plotted. Analysis of the data in the insert (c) showed the average values plotted post doc t test. (d) Difference in GR-Hsp90 (r = 0.60) and GR-Hsp70 (r = 0.56) binding percentages, depicting difference in these interactions (Δ) in EPI and NON-EPI brain tissue (n = 8 subjects) were directly correlated with individual seizure onset age (years) among the small specimen cohort analyzed. Results are expressed as mean ± SEM by ANOVA, *p < 0.05.
