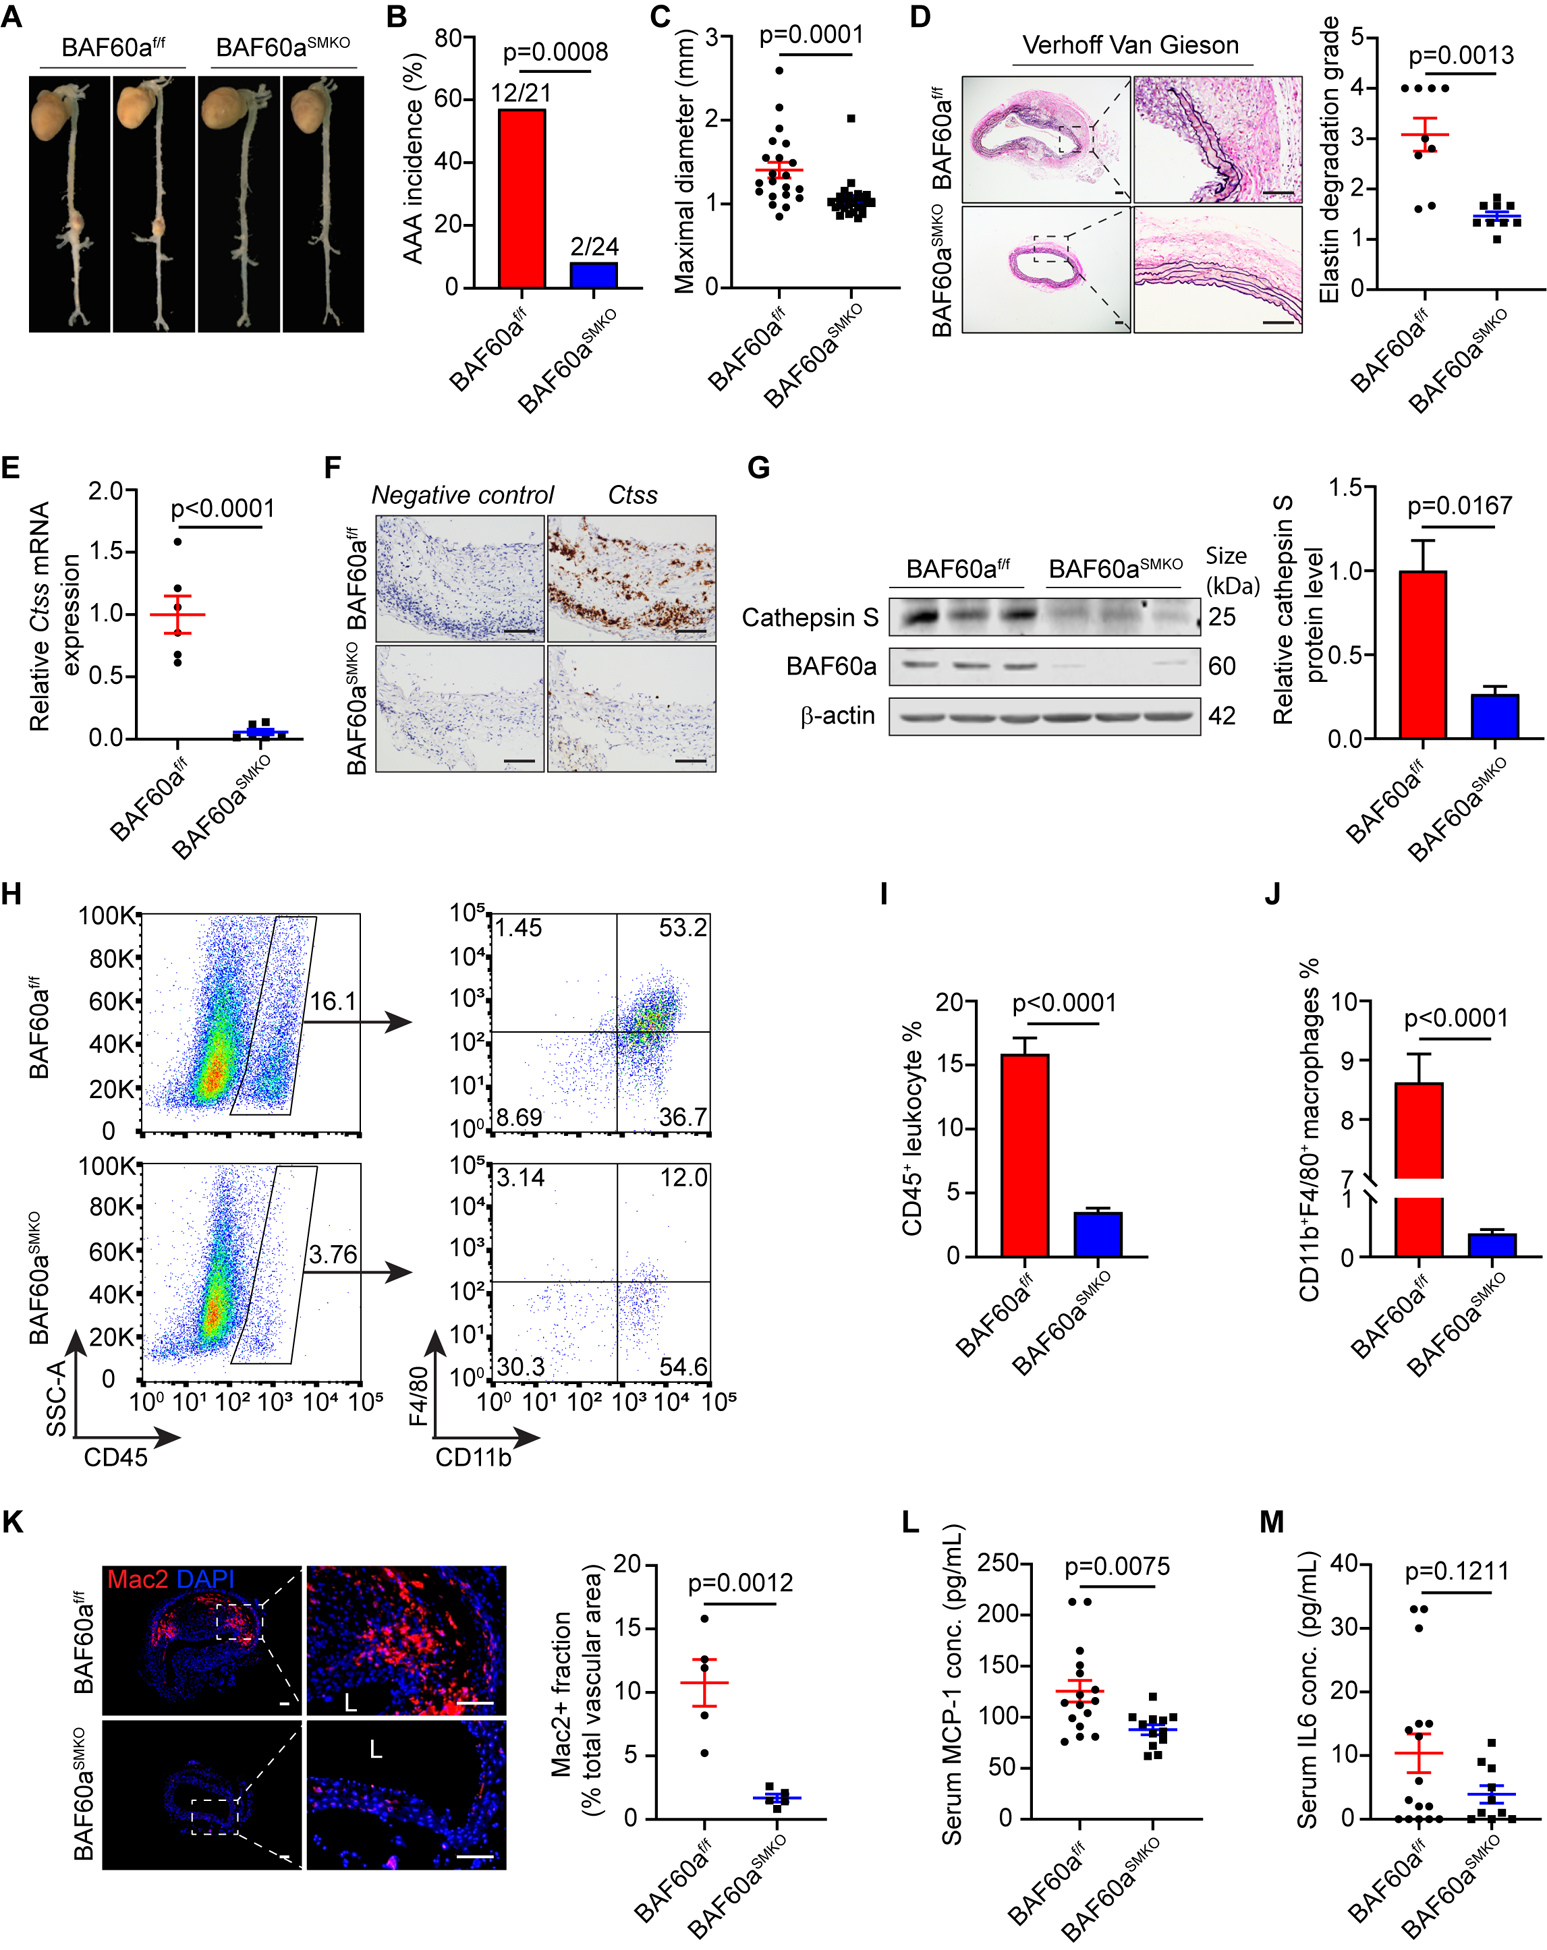
Figure 2. VSMC-specific BAF60a knockout attenuates AngII-induced AAA in mice.

In the AngII-induced AAA model, 8 to 10 weeks old male BAF60af/f (n=24) and BAF60aSMKO (n=25) mice were given AAV-Pcsk9 (i.p.) and Western diet to generate hypercholesterolemia followed by AngII (1,500 ng/kg/min) infusion for 28 days. A, Representative morphology of aortas. B, Incidence of AAA; rupture events in the thoracic aorta were excluded from the AAA incidence. C, Quantification of maximal external diameters of suprarenal abdominal aortas. D, Representative images of Verhoff Van Gieson staining in suprarenal abdominal aortic sections and quantification analysis of elastin fragmentation (n=9 for each group). Scale bar=100 μm. E, Cathepsin S mRNA expression was determined by qPCR in the aortic RNA extracts (n=6 for each group). F, Representative images of RNAscope in situ hybridization assay to detect Cathepsin S mRNA in aortic sections (n=3 for each group). Scale bar=100 μm. G, Cathepsin S protein level was determined by Western blot in abdominal aortic protein extracts (n=3 for each group). H-J, Single cells were isolated from abdominal aortas of BAF60af/f (n=3) and BAF60aSMKO (n=3) mice after 28 days of AngII infusion and subjected to flow cytometry analysis. H, Representative dot plots showing the gating strategy to obtain the macrophage population (CD11b+F4/80+) from gated CD45+ leukocytes. I, Quantitative analysis of the percentage of CD45+ leukocytes. J, Quantitative analysis of the percentage of CD11b+F4/80+ macrophages. K, Representative images of Mac2 staining (red) and quantification analysis of Mac2+ fraction in abdominal aortas of BAF60af/f (n=5) and BAF60aSMKO (n=5) mice. Scale bar=100 μm; L, lumen. L-M, Serum concentrations of MCP-1 (BAF60af/f, n=16; BAF60aSMKO, n=12) (L) and IL-6 (BAF60af/f, n=16; BAF60aSMKO, n=10) (M) were determined by ELISA. Data are presented as mean ± SEM. Chi-squared test for B, Mann-Whitney test for C, Student’s t-test for D, E, G, and I-M.
