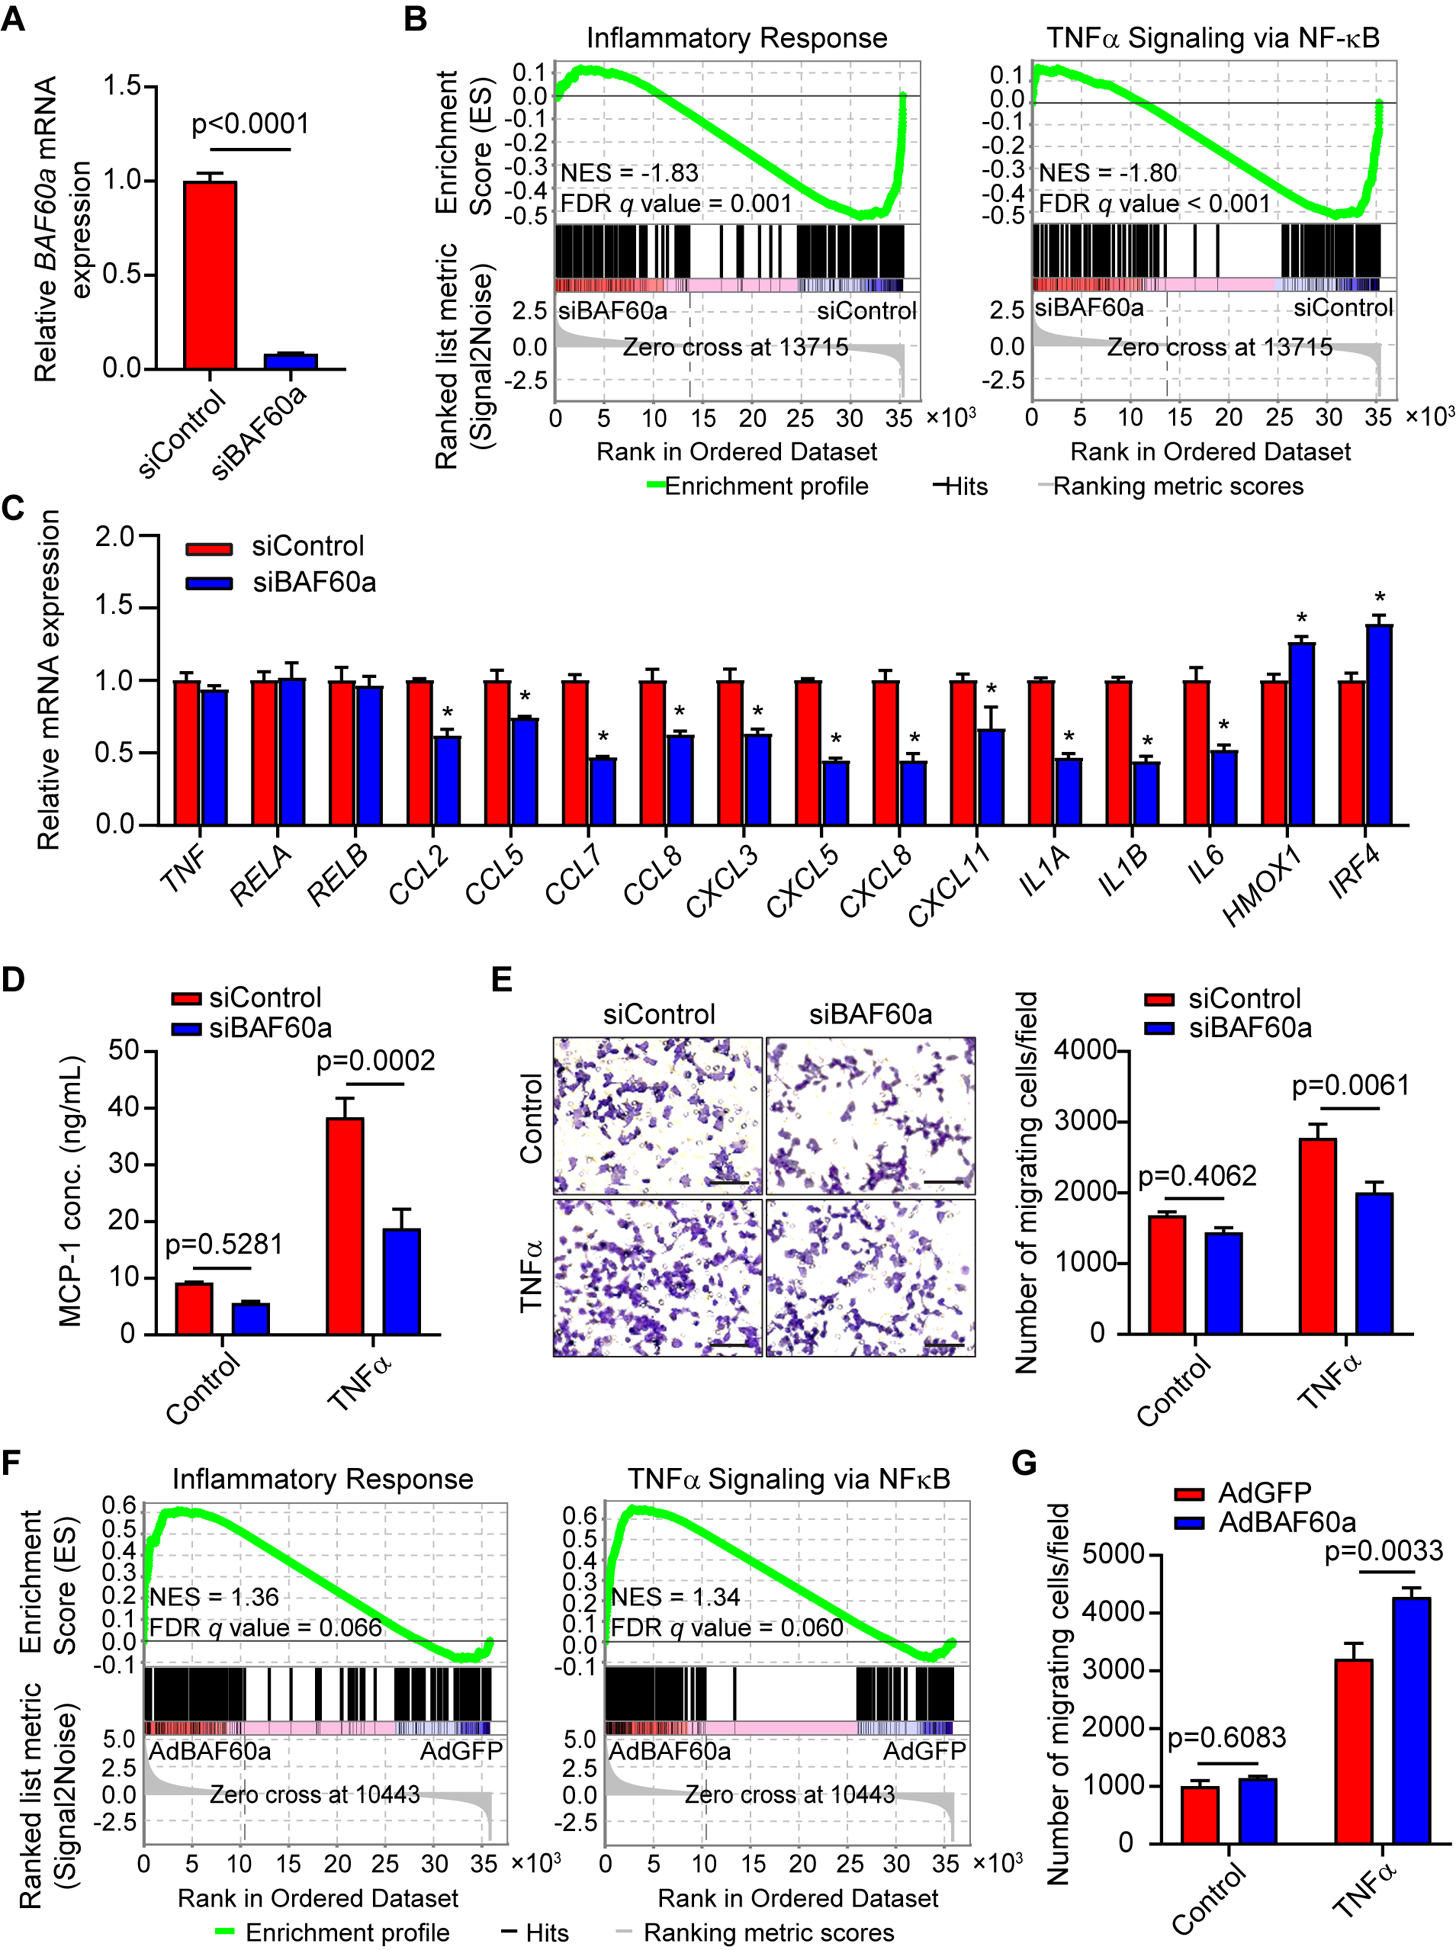
Figure 3. BAF60a regulates vascular smooth muscle cell inflammation.

A-B, HASMCs were transfected with siControl or siBAF60a (30 nM). After 72 hours, total RNA was extracted for RNA-seq (n=3 for each group). A, BAF60a mRNA expression was determined by qPCR. B, Negative enrichment in the pathways for Inflammatory Response (left) and the TNFα Signaling via NF-κB (right) is shown in GSEA plots (siBAF60a vs. siControl). C, qPCR Validation of representative NF-κB target genes identified by RNA-seq in 3 independent sets of samples treated as in A. n=3 for each group. D, MCP-1 concentration was measured by ELISA in the cell culture medium of HASMCs transfected with siControl or siBAF60a for 48 hours followed by treatment with or without TNFα (20 ng/ml, 24h). n=3. E, Representative images (magnified field, left) and quantitative analysis (right) of the macrophages migrated through the transwell toward the conditioned media from HASMCs transfected with siControl or siBAF60a, with or without TNFα stimulation (20 ng/ml, treated for 4 hours before changing to fresh medium and incubated for another 20 hours). n=3. Scale bar=100 μm. F, HASMCs were infected with AdGFP or AdBAF60a (20 MOI). After 48 hours, total RNA was extracted for RNA-seq (n=3 for each group). Positive enrichment in the Inflammatory Response (left) and the TNFα Signaling via NF-κB (right) pathways is shown in GSEA plots (AdBAF60a vs. AdGFP). G, quantitative analysis of the macrophages migrated through the transwell toward the conditioned media from HASMCs infected with AdGFP or AdBAF60a, with or without TNFα stimulation (20 ng/ml, treated for 4 hours before changing to fresh medium and incubate for another 20 hours). n=3. Data are presented as mean ± SEM. *p< 0.05. Student’s t-test for A, one-way ANOVA followed by Tukey’s post hoc analysis for C, and two-way ANOVA followed by Holm-Sidak post hoc analysis for D-E and G.
