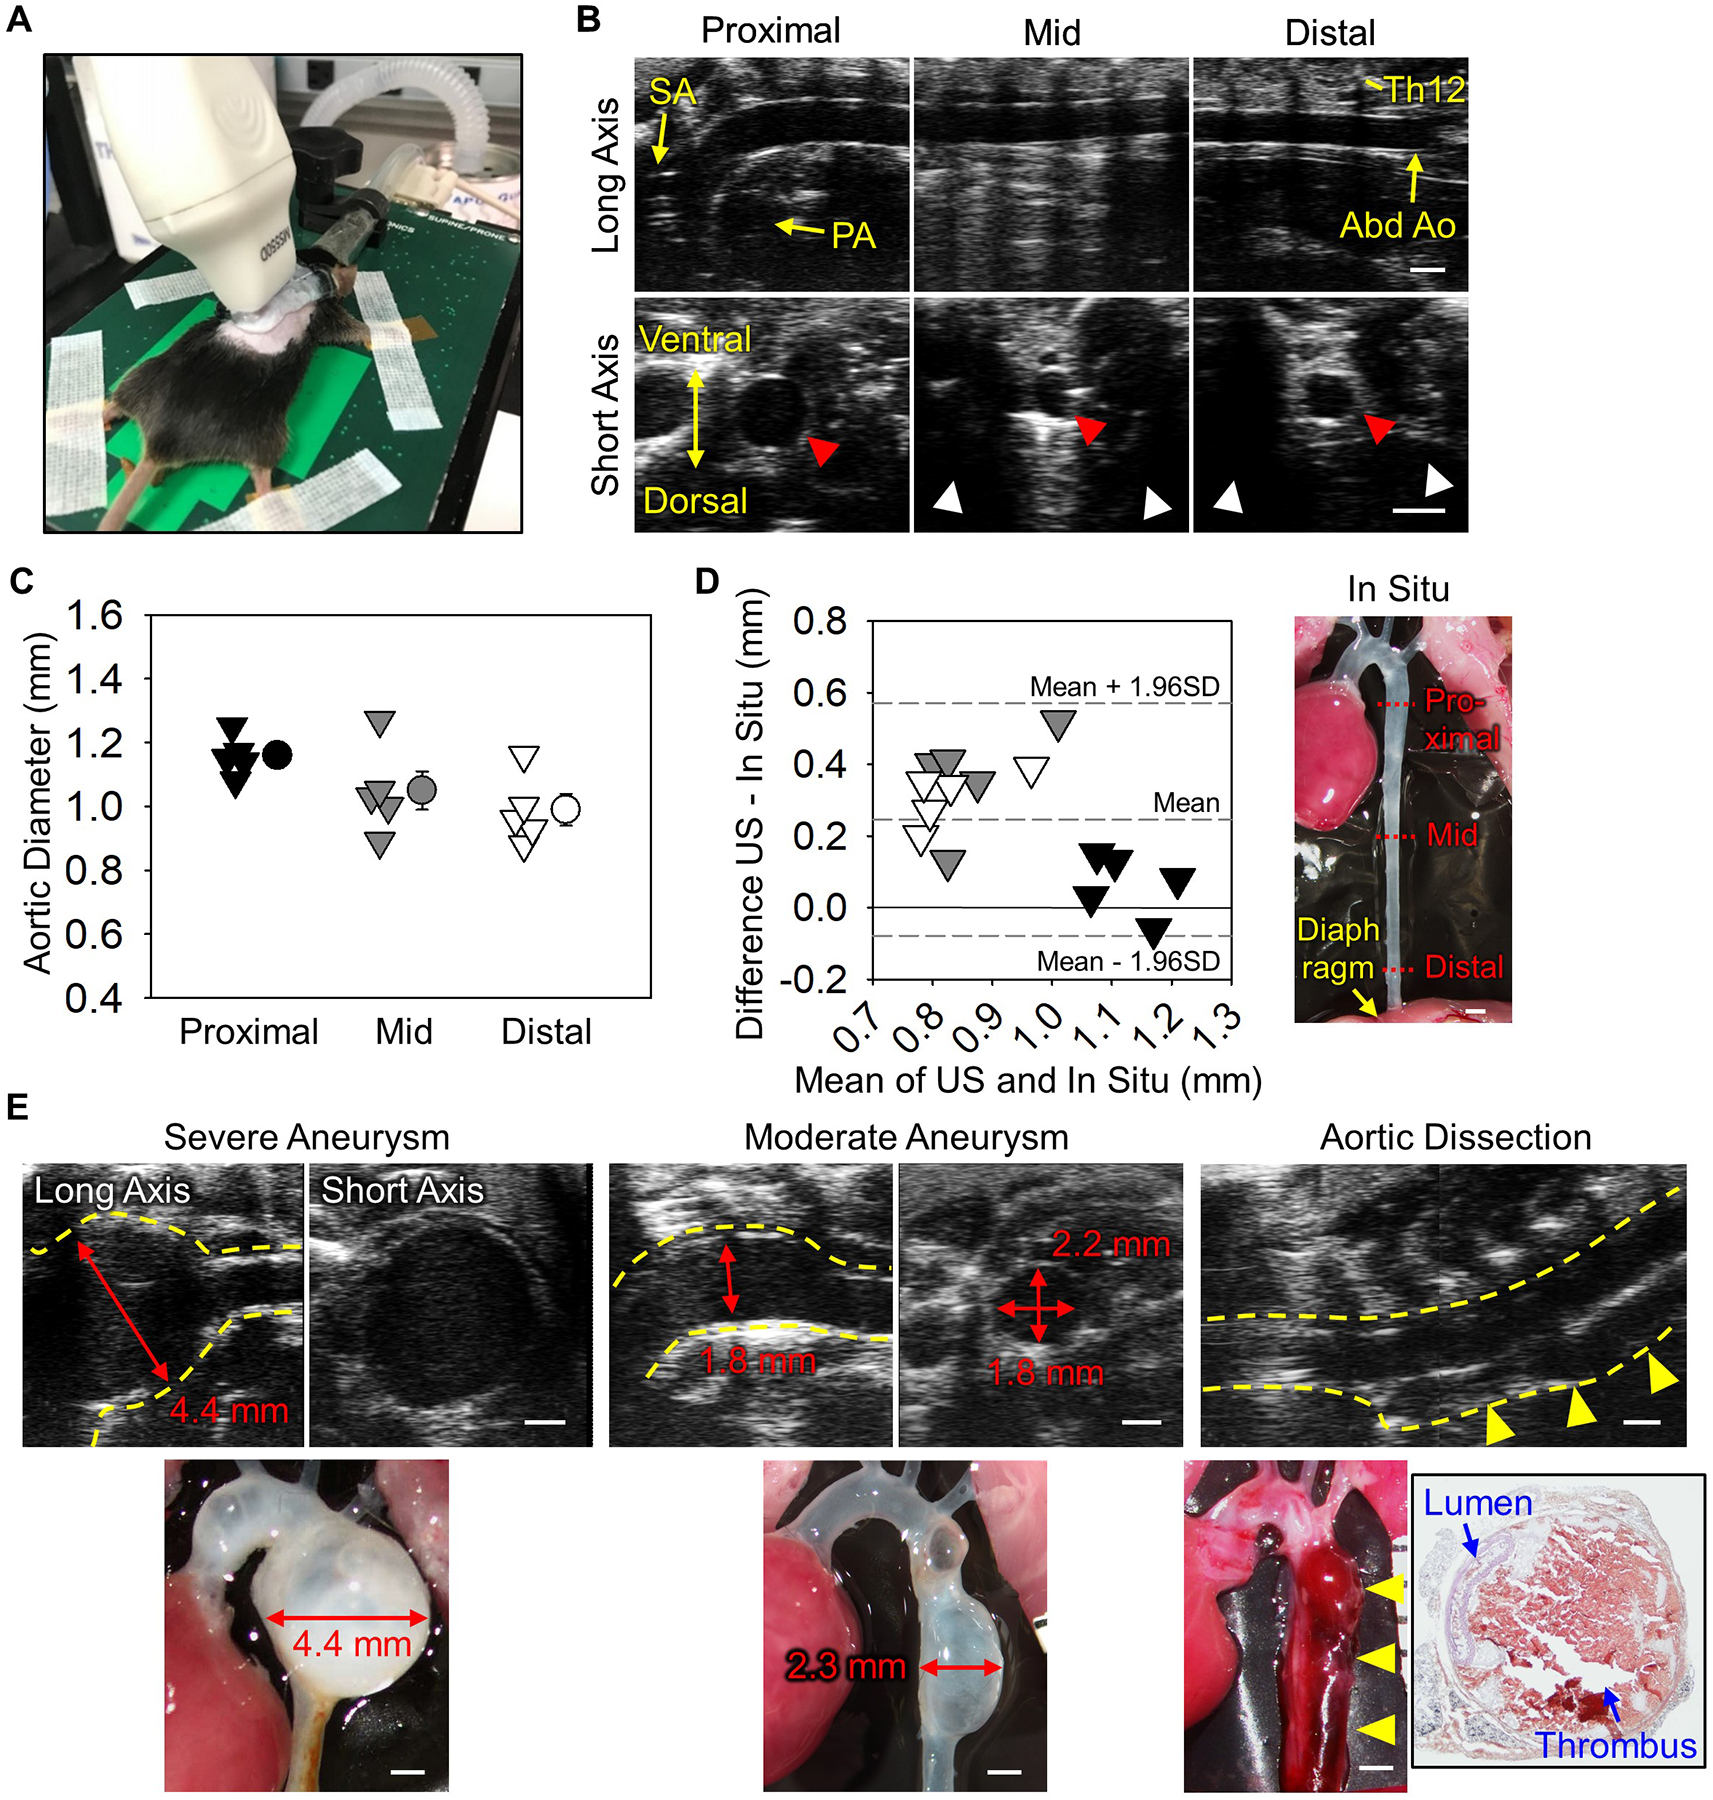
Ultrasound in vivo monitoring of the descending aorta in mice.

(A) Probe placement for a left para-spinal long axis view. (B) Representative long and short axis left para-spinal ultrasound images of non-aneurysmal descending aortas at proximal, mid, and distal regions. SA indicates subclavian artery; PA, pulmonary artery; Abd Ao, abdominal aorta; and Th12, 12th thoracic vertebra. Red and white arrow heads indicate descending aortas and acoustic shadows. (C) Aortic diameters at proximal, mid, and distal regions of the descending aorta at mid-systole. n=5. (D) Bland-Altman plot shows variation between in situ versus ultrasound measurements at proximal, mid, and distal regions. (E) Representative ultrasound images of severe and moderate descending aortic aneurysms and dissection induced by BAPN. Red arrows indicate maximal aortic diameter. Yellow dotted lines and arrow heads indicate the aortic wall and dissected region, respectively. Black box shows hematoxylin-eosin staining of aortic dissection. Scale bar, 1 mm.
