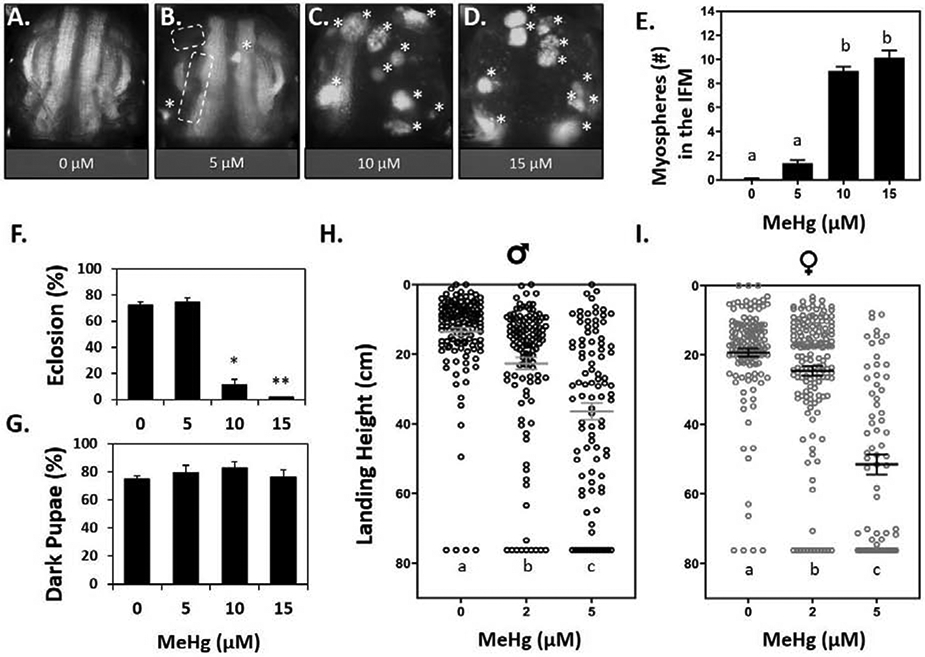
Fig. 2. Dose responsive IFM morphological and flight function defects following larval exposure to MeHg.

(A - D) Representative images of 49 - 57 h APF mδ:RFP pupae treated with 0, 5, 10, or 15 μM MeHg. Asterisks (*) indicate average number of myospheres per treatment. Dashed lines indicate missing DVM group. (E) Quantification of myospheres in the IFM (n ≥ 23 pupae per treatment, letters indicate pair-wise significant differences where p < 0.05, ANOVA). (F) Eclosion function (represented as a percent) in mδ:RFP flies decreases with increasing MeHg exposure, and G) the percent of these individuals that developed to dark pupae by day 13 (n = 150 pupae per treatment, *p < 0.05, **p < 0.001, Z-test). (H - I) Landing height of male (H) and female (I) wildtype (Canton S.) adults after larval exposure to 0, 2, or 5 μM MeHg. Horizontal bars represent mean landing height ± SEM for each group (n ≥ 100 flies per treatment, letters indicate pair-wise significant differences where p < 0.05, Kruskal-Wallace, Dunn’s post-hoc for multiple comparisons).
