Fig. 2.

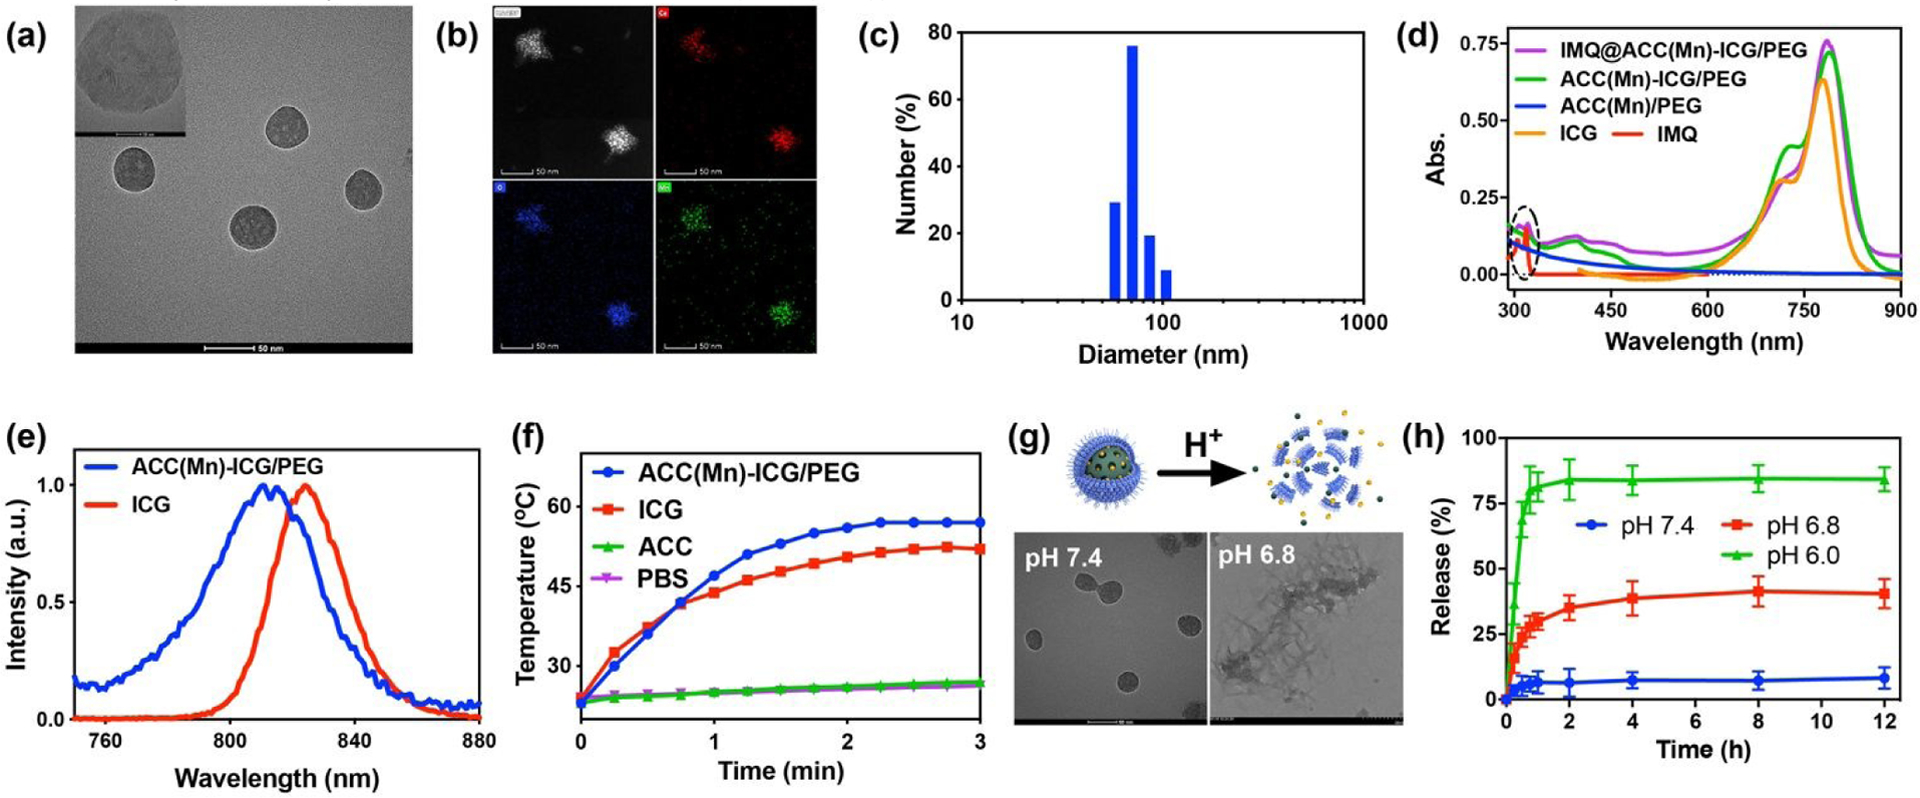
Synthesis and characterization of IMQ@ACC(Mn)-ICG/PEG NPs. (a) Transmission electron microscopy (TEM) image of ACC(Mn)-ICG NPs. Scale bar = 51 nm. (b) Representative scanning TEM images of ACC(Mn)-ICG NPs showing the calcium (red), oxygen (blue) and manganese (green). (c) Hydrodynamic size of ACC(Mn)-ICG/PEG NPs determined by dynamic light scattering. (d) UV-vis-NIR absorbance spectra of ACC(Mn)/PEG NPs, ICG, IMQ, ACC(Mn)-ICG/PEG NPs, and IMQ@ACC(Mn)-ICG/PEG NPs. (e) Fluorescence spectra of ICG and ACC(Mn)-ICG/PEG NPs. (f) Temperature elevations of PBS, ACC(Mn)/PEG NPs, ICG, and ACC(Mn)-ICG/PEG NPs under an 805 nm laser irradiation (0.75 W cm−2). (g) Scheme illustrating the acid-responsive decomposition of ACC(Mn)-ICG/PEG NPs and their corresponding TEM images after incubation in PBS with different pH values for 2 h. (h) Time-dependent release profiles of imiquimod (IMQ) from IMQ@ACC(Mn)-ICG/PEG NPs incubated in PBS at different pH values.
