
Figure 4. Role of cytoskeletal rearrangement and Cdc42 activity in the effect of AIBP on lipid rafts.
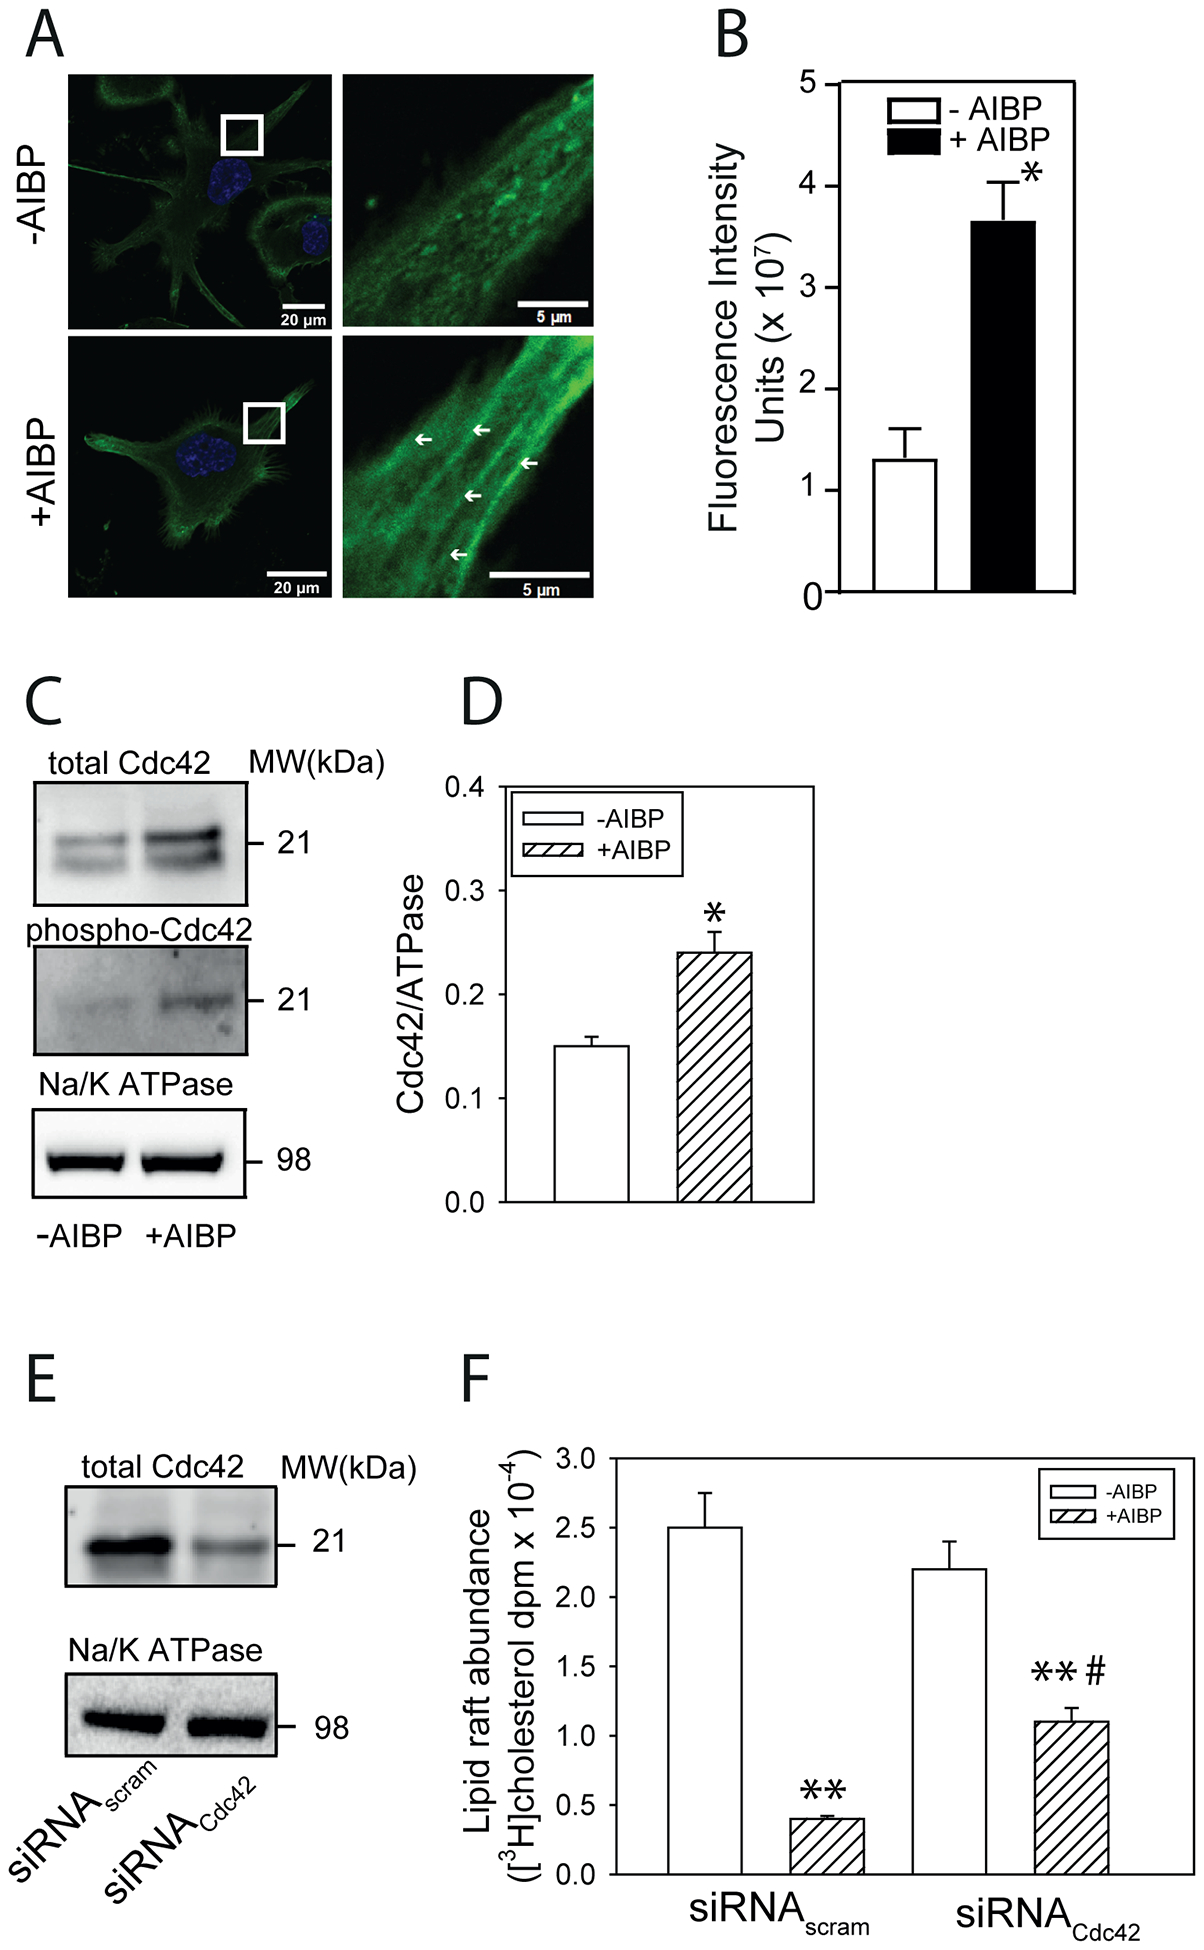
A – The effect of AIBP (0.4 μg/ml, 2 h) on the abundance of F-actin in THP-1 cells. Panels on the right show higher magnification of the designated area from the left panels, arrows point to the microfilament-like F-actin structures (LifeAct staining, confocal microscopy). Scale bars left panels – 20 μm, right panels - 5 μm. B – Quantitation of the effect of AIBP (0.4 μg/ml, 2 h) on the abundance of F-actin by confocal microscopy (LifeAct staining, mean fluorescence intensity). Mean ± SEM are shown, *p<0.05, n=6. C - The effect of AIBP (0.4 μg/ml, 4 h) on the abundance of total CdC42 and phosphorylated Cdc42 in THP-1 cells (Western blot). D – Quantitation of the effect of AIBP on the abundance of total CdC42 in THP-1 cells (densitometry of Western blot). *p<0.05, n=5. E - The abundance of total CdC42 after treatment of THP-1 cells with siRNACdc42 (Western blot). F – The abundance of [3H]cholesterol in lipid raft fractions after isolation of rafts by sequential gradient centrifugation from THP-1 cells untreated or treated with AIBP (0.4 μg/ml, 4 h) with or without Cdc42 silencing. Mean ± SEM are shown, **p<0.01 versus no AIBP, #p<0.05 versus siRNAscram; n=3.