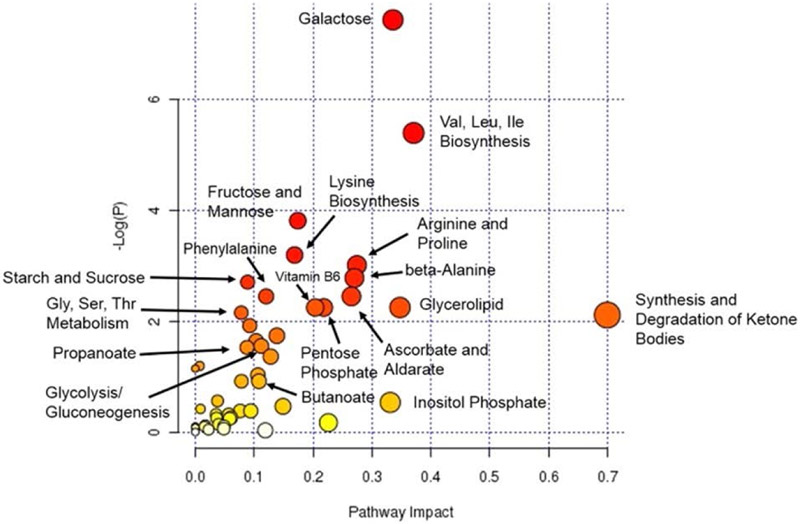
Figure 7.
MetPA analysis pathways. Node size and color indicate the degree of importance. Large red nodes are pathways with the highest level of change in diabetes. Orange, yellow, and white nodes represent moderate, slight, and zero importance, respectively. Reprinted with permission from: L. A. Filla, W. Yuan, E. L. Feldman, S. Li and J. L. Edwards, Journal of Proteome Research, 2014, 13, 6121-6134.

