Abstract
Paclitaxel coated balloon catheters (PCB) were developed as a polymer-free non-implantable alternative to drug eluting stents, delivering similar drug payloads in a matter of minutes. While PCB have shown efficacy in treating peripheral arterial disease in certain patient groups, restenosis rates remain high and there is no class effect. To help further optimize these devices, we developed a scanning electron microscopy (SEM) imaging technique and computational modeling approach that provide insights into the coating micromorphology dependence of in vivo drug transfer and retention. PCBs coated with amorphous/flaky or microneedle coatings were inflated for 60sec in porcine femoral arteries. Animals were euthanized at 0.5, 24 and 72h and treated arteries processed for SEM to image endoluminal coating distribution followed by paclitaxel quantification by mass spectrometry (MS). Endoluminal surfaces exhibited sparse coating patches at 0.5h, predominantly protruding (13.71 vs 0.59%, P<0.001), with similar micro-morphologies to nominal PCB surfaces. Microneedle coating covered a 1.5-fold endoluminal area (16.1 vs 10.7%, P=0.0035) owing to higher proximal and distal delivery, and achieved 1.5-fold tissue concentrations by MS (1933 vs 1298 μg/g, P=0.1745) compared to amorphous/flaky coating. Acute longitudinal coating distribution tracked computationally predicted microindentation pressure gradients (r=0.9, P<0.001), with superior transfer of the microneedle coatings attributed to their amplification of angioplasty contact pressures. By 24h, paclitaxel concentration and coated tissue areas both declined by >93% even as nonprotruding coating levels were stable between 0.5–72h, and 2.7-fold higher for microneedle vs flaky coating (0.64 vs 0.24%, P=0.0195). Tissue retained paclitaxel concentrations at 24–72h trended 1.7-fold higher post treatment with microneedle coating compared to the amorphous/flaky coating (69.9 vs 39.9 μg/g P=0.066). Thus, balloon based drug delivery is critically dependent on coating micromorphologies, with superior performance exhibited by micromorphologies that amplify angioplasty pressures.
Keywords: Drug coated balloons, Peripheral artery disease, Coronary artery disease, Paclitaxel
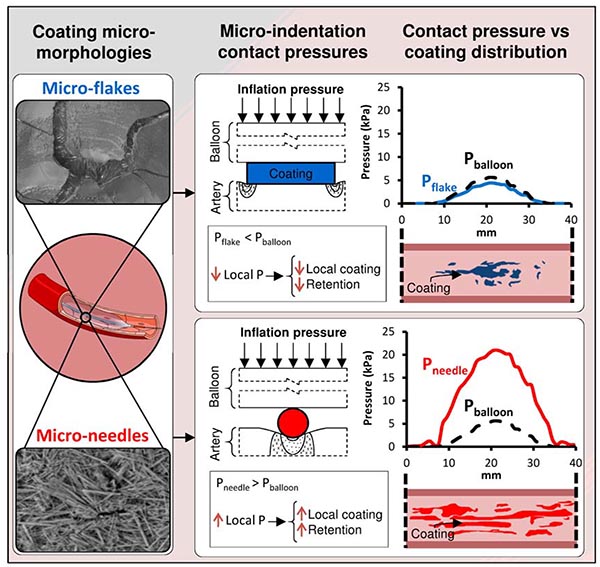
Graphical Abstract
1. Introduction
Paclitaxel coated balloons (PCBs) have emerged as an effective alternative to percutaneous balloon angioplasty in the treatment of femoropopliteal peripheral artery disease, by reducing reintervention due to restenosis1. The use of paclitaxel is based on its anti-restenotic efficacy when delivered from stents2, its superior lipophilicity and tissue retention3, 4 and its demonstrated ability to inhibit cell migration and proliferation even after short in vitro exposures of soluble drug5. However, the very lipophilicity of paclitaxel which is the basis for its enhanced tissue distribution and retention also limits its elution during short balloon inflations and subsequent penetration into arterial tissue. Thus, early experience with pure paclitaxel coatings on balloons was disappointing and efficacious delivery was only achieved through the successful formulation with appropriate excipients that enhance the transfer of solid paclitaxel coating particles to the artery wall6, 7.
Currently, formulations of PCBs abound, each with their own excipient, load (2–3.5 μg/mm2), crystallinity, morphology, and propensity for fragmentation that may result in different drug delivery mechanisms and effects7. While there are no head-to-head comparisons of PCBs, available clinical data speaks to the absence of a PCB class effect8 and to the dependence of device efficacy on the achieved net tissue dose9, 10. Thus for example, animal studies comparing PCB with the same loading dose (3.0 μg/mm2) have demonstrated prolonged tissue retention for crystalline versus amorphous paclitaxel coatings, and with it enhanced inhibition of intimal hyperplasia11. Similarly, Stellarex and Lutonix are both coated with 2.0 μg/mm2, the former exhibiting superior patency which has been attributed to the presence of a crystalline coating component that is absent in the latter12, 13. Moreover, prior experience with local vascular delivery teaches that the spatial distribution of transferred coating may be as or more important as the net amount, as mere proximity of the delivery device does not ensure adequate targeting14–16. Indeed, the decline in PCB efficacy with increasing calcification arc angle17 speaks to the importance of achieving spatially uniform coating delivery across the length and circumference of the target lesion. Moreover, embedding state of the transferred coating may also be important as animal experiments and computational modeling11, 18 both suggest that tissue embedment of prolongs drug retention compared to endoluminally distributed coating. There is therefore a keen interest in understanding the dependence of arterial drug distribution on coating properties. Unfortunately, such understanding has been limited by the traditional methods for characterizing arterial drug distribution, i.e. bulk or compartmental tissue quantification of drug11, 19 supplemented by qualitative histological observations of transmural coating in treated arteries20, 21. While anti-drug antibodies or matrix assisted Laser Desorption/Ionization (MALDI) have been used to quantify the distribution of drug coating in thin (5–10 μm) arterial cross sections16, 22, the applicability of these methods for mapping endoluminal distribution of coating and its micromorphology remains to be proven.
To address these needs, the current study reports the development of a scanning electron microscopy (SEM)-based imaging method designed to visualize and quantify the endoluminal distribution and micromorphology of paclitaxel coatings after treatment with PCBs and to assess its embedding state. Moreover, to gain mechanistic insights into the dependence of local endoluminal transfer on coating micromorphology we developed a novel computational model for predicting local arterial tissue microindentation contact pressures exerted by coating particles during balloon expansion, allowing for correlation of imaged coating transfer gradients across the treatment zone with simulated contact pressure gradients for each of the coating morphologies. The applicability of the methods developed herein are agnostic to the chemical nature of the drug and therefore extend to other drugs besides paclitaxel.
2. Methods
2.1. Devices
Three PCB types were used in this study: amorphous/flaky paclitaxel coating on a nylon surface (IN.PACT Admiral; Medtronic, Santa Rosa, CA), microcrystalline paclitaxel coating on a nylon surface (MCN, W.L. Gore & Associates, Flagstaff, AZ) and the same microcrystalline paclitaxel coating on an expanded polytetrafluoroethylene (ePTFE) covered surface (MCEP; W.L. Gore & Associates, Flagstaff, AZ). In both cases the microcrystalline coating was applied using a micro pipetting technique. All 3 balloon types were 40 mm long and nylon based, with similar nominal paclitaxel doses (IN.PACT and MCN: 3.5 μg/mm2, MCEP: 4.1 [5×40 mm] or 3.6 [6×40 mm] μg/mm2). All three test PCBs were coated with their unique paclitaxel coating prior to balloon folding and sterilization. The ePTFE used in MCEP is more porous than Nylon as it was hypothesized that this would improve coating adherence to the balloon and may facilitate transfer to the tissue. The current study was designed to compare the local coating and distribution achieved by these 3 device types.
Pilot porcine experiments comparing IN.PACT with an early variant of MCEP (MCEP F3) demonstrated higher local release for the former (1648 vs 713 μg, P< 0.0001) but a trend for higher tissue concentrations for the latter (Supplemental Table 1).
2.2. Animal model and experimental overview
All animal experiments were performed at CBSET, Inc. (AAALAC accredited) and adhered to the Guide for the Care and Use of Laboratory Animals under an Institutional Animal Care and Use committee-approved protocol. In total, 36 peripheral arteries (18 superficial and 18 deep femoral arteries) from 9 castrated male Yorkshire swine (37.9 to 54.5 kg) were assessed. Treatments were randomized to minimize variability with each animal receiving a total of four treatments and all 3 PCB types, totaling 12 PCBs for each type.
Under fluoroscopic guidance, a guide catheter (9F Avanti, Cordis, Milpitas, CA) was advanced over a guide wire into the descending aorta and to the target peripheral arteries. Angiographic images of the vessels identified the proper location for the deployment site and aided in tissue collection. PCBs were expanded once at the deployment site to a targeted overstretch of 10–20%, via visual assessment, to ensure complete apposition to the vessel wall. Once final pressure was reached, the balloons remained inflated for 60 sec. After the inflation period, balloons were deflated and removed, cut from the catheter and stored in separate vials at −80°C, then shipped to W.L. Gore & Associates (Flagstaff, AZ) for quantification of residual paclitaxel.
2.2.1. Euthanasia and tissue collection
Animals were euthanized at 0.5, 24 and 72h (n=4 per time point and device) under anesthesia via an overdose of potassium chloride (2 mEq/kg, IV) in accordance with accepted AVMA guidelines. In the acute group, each animal was euthanized within 5–10 minutes from the last treatment, ensuring artery harvest within 0.5h of treatment. Arteries were perfused with physiological solution without pressure to maximize coating preservation in the tissue and minimize blood clot presence. Treated arterial segments (~40 mm), including untreated proximal and distal excess tissue (~20 mm), were removed intact so as not to affect transferred coating. Vessels were placed in ice cold saline prior to processing for imaging.
2.3. Scanning electron microscopy
All samples were imaged using a scanning electron microscope (SEM, Hitachi S3400-NII). One control PCB of each type was inflated with air and imaged to provide visual reference for coating morphologies in tissue findings. Excised vessels were cleaned of excess adventitia, cut longitudinally, and mounted whole on a flat surface with defined orientation and processed for imaging. Processing and imaging were conducted in a blinded fashion. Low (15–20×) and medium (50×) magnification images were acquired for all samples (PCBs and arteries) in automated mode. Additional high magnification images (≥150×) were taken at selected locations to resolve coating micromorphology on balloon and arterial surfaces, including individual microneedles. Imaged vessels were then weighed and stored in separate vials at −80°C and shipped to Agilux (Worceter, MA) for paclitaxel quantification.
2.3.1. Quantitative mapping of coating in SEM images
Quantitative mapping of coating on non-deployed PCBs and treated vessels was performed on enface SEM images with a Fiji image analysis platform.23 Treatment locations were identified on angiographic images and shrinkage estimated as the length of the mounted tissue sample divided by 40 mm. As coating particles can be minute (especially for microcrystalline coatings), a morphometric approach was used to outline coated areas as judged by an experienced morphometrist. Thresholding was achieved by only outlining areas exhibiting high-density coating clusters that were visible in low magnification (20×) images (Supplemental Figure 1 A–C), and when in doubt, confirmed on medium magnification (50×) images so as to exclude false positives (Supplemental Figure 1 Ai–Ci). On average, 34 low magnification and 158 medium magnification images were acquired and assessed per vessel. Visual inspection of medium magnification images also informed the categorization of coated areas as protruding or nonprotruding relative to tissue folds, partially covered by a thin tissue layer or fully embedded into the tissue. Longitudinal distributions of coated areas were derived per image by calculating the percentage of pixels residing within outlined areas within 1 mm length bins (accounting for sample shrinkage as above). Distribution spreads were defined as the linear distance of the luminal coating at 25, 50 and 75% of peak distribution. Percent coated tissue (PCT) per montage was calculated by normalizing the outlined areas containing protruding and nonprotruding drug coating to the total treated area, and correlated with the corresponding paclitaxel concentration, measured as described below.
2.4. Drug quantification
Stored tissue and balloon samples were extracted under vortexing and sonication in 1mL of 0.5% formic acid in methanol four times. Extracted paclitaxel was quantified using a validated LC-MS/MS method on a SCIEX Triple Quad 5500+ LC-MS/MS System with 13C6 paclitaxel (ChromaDex) as an internal standard. Stored balloon samples were also extracted under sonication in 1ml acidic methanol solution. Drug release was calculated as the difference between nominal load and residual paclitaxel las measured on the balloon extracts by ultra performance liquid chromatography on an I-Class UPLC (Waters, Milford, MA).
Total residual paclitaxel on balloon samples was measured by ultra performance liquid chromatography on an I-Class UPLC (Waters, Milford, MA) and drug release was calculated as the difference between nominal and residual drug loads.
2.5. Simulation of angioplasty and microindentation contact pressure at gradients
We developed computational models to predict the variation of contact stress along the balloon-tissue interface (Supplemental Appendix). Macroscopic radial pressure along the contact axis was computed using an axisymmetric balloon angiography model that accounts for spatially nonuniform inflation pressures inferred from time series images of free expansion, tissue hyperelasticity24, nominal balloon dimensions and angiographic arterial diameters at baseline and full expansion (Figure 1 i–iii).
Figure 1.
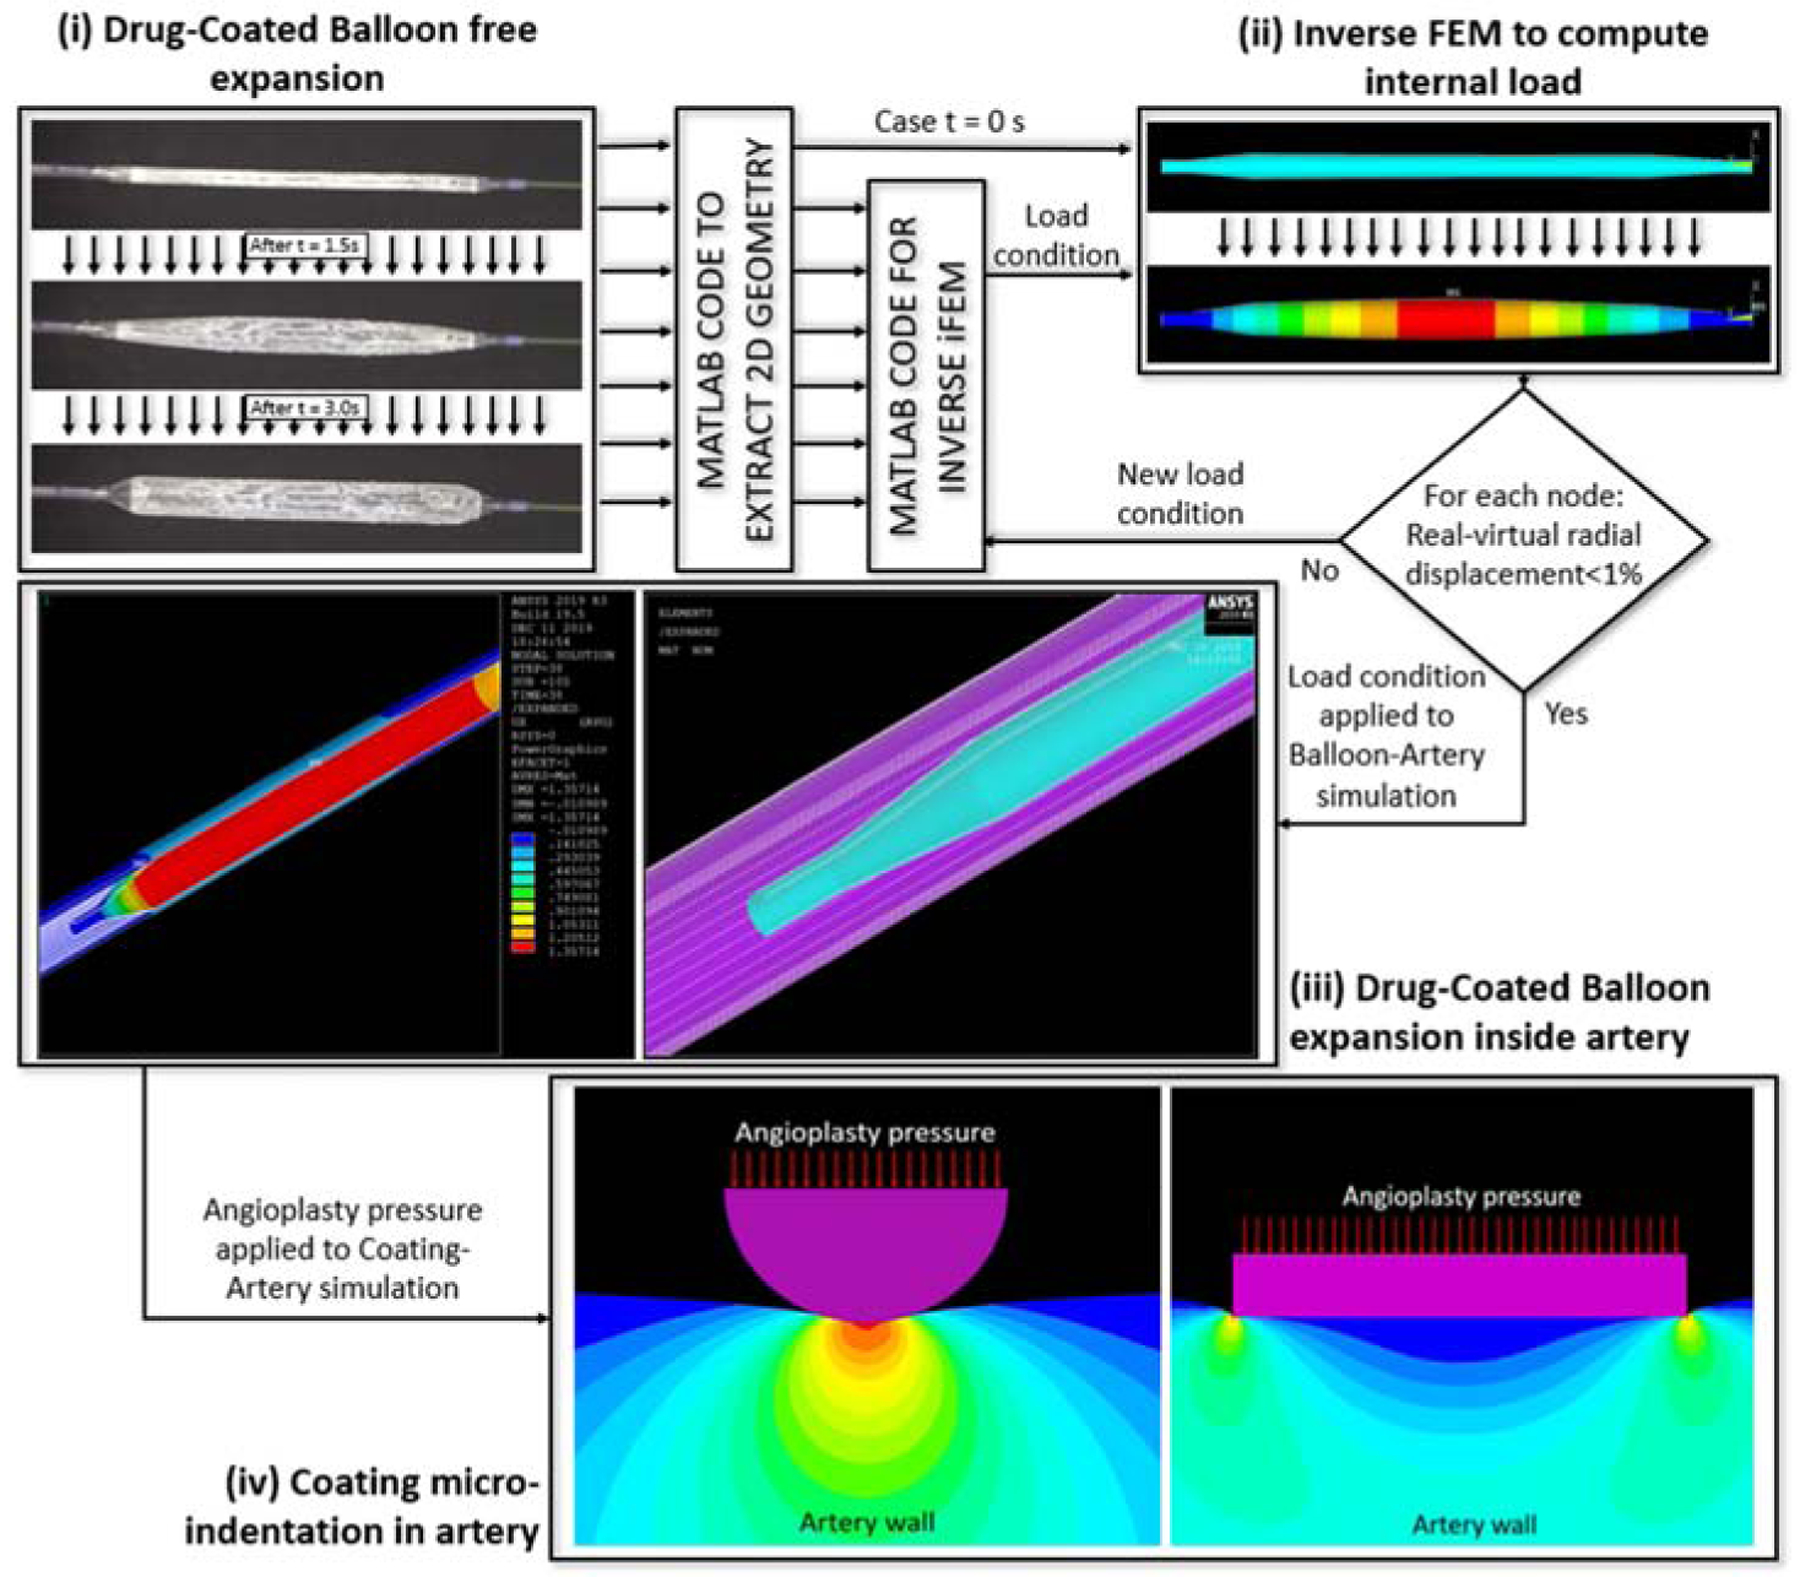
Computational prediction of angioplasty and microindentation pressure distributions. (i) Time series images (3 s) of a freely expanding IN.PACT PCB were used to calculate the internal pressure distribution in (ii) by applying an inverse finite element method (iFEM) to the balloon outline extracted from images (ii, top). The estimated internal pressure distribution was then used to (iii) model PCB expansion within a perfectly cylindrical hyperelastic artery. (iii, right) One-half symmetry expansion of the initial mesh of the balloon based on computed images (blue) and idealized artery model (purple). (iii, left) Radial displacement achieved after full balloon expansion within the artery. The computed radial angioplasty pressure was imposed at the balloon-coating interface to compute steady- state tissue microindentation strains (iv). Full details are provided in the Supplemental Appendix.
As the expanding balloon contacts the arterial wall it presses the coating onto the tissue, giving rise to microindentation pressures that differ from the applied balloon angioplasty pressure25. At the scale of coating microparticles the pressure P exerted by the inflating balloon is spatially invariant, allowing it to be imposed as a boundary pressure that drives hyperelastic tissue microindentation (Figure 1 iv). To facilitate a two-dimensional modeling approach, microneedles were idealized as long micro-cylinders and flat coating flakes were idealized as circular disks. Simulated microindentation pressures along the particle-tissue interface were shown to be well approximated by classical analytical solutions for the limit of elastic coating and tissue (Supplemental Figure 2). This facilitated the calculation of the average microindentation pressure (kPa) at the coating particle-tissue interface , using closed form estimates (Eqs. S5 and S11, Supplemental Appendix),
| (Eq. 1) |
for the flat coating flakes idealized as circular disk26, and
| (Eq. 2) |
for the microneedles idealized as micro-cylinders27. Here Eart (150 kPa) and νart (0.499) are, respectively, the artery’s Young’s modulus and Poisson’s ratio28.
2.6. Correlation of longitudinal coating distribution with longitudinal microindentation pressures
At each distance x from the proximal end of the treatment zone, the average microindentation pressure was computed by substituting the computed radial angioplasty pressure P(x) into Eq. 1 for disk-flakes and Eq. 2 for microneedles. To account for overstretch variations, model results were generated for, and averaged over, four expansion diameters corresponding to mean measured diameter at full expansion ±2.5% or ±7.5% and a mean overstretch of 8±7%.
The dependence of measured longitudinal coating distribution on computed longitudinal microindentation pressure was fit to piecewise-linear function
| (Eq. 3) |
Here Y denotes PCT per unit length, p the corresponding microindentation pressure computed for each coating particle geometry, p0 the threshold for slope change, from Slope1 to Slope2.
2.7. Data analysis and statistical methods
All data are presented as the mean ± standard error. Statistical analyses and data fits were performed using Prism 6.0 (GraphPad Software, San Diego, CA). Multiple comparisons were performed using one way ANOVA followed by a Tukey test. Pairwise comparisons were performed using an unpaired t-test with Welch’s correction. Correlations between continuous data sets were performed using the Pearson test. In all cases, the null hypothesis of no difference was only rejected if the value of the calculated statistic was P<0.05
3. Results
3.1. PCB coating morphology and release
High magnification images of the folded balloons revealed microneedles on MCEP and a cracked surface on IN.PAC, with microcrystals apparent within the cracks (Supplemental Figure 3 A–B). Low magnification (15×) images of inflated non-deployed PCBs (n=1/type) revealed nominal coating imperfections, particularly along folding lines (Figure 2 A–C and Supplemental Figure 4 A–C). Higher magnification clearly resolved needle-shaped microcrystals on the surfaces of MCEP (Figure 2 Ai, Supplemental Figure 3 Ai–Aiii) and MCN (Figure 2 Bi, Supplemental Figure 4 Bi–Biii), that were absent from the surfaces of inflated IN.PACT which retained their preinflated smooth/cracked appearance (Figure 2 Ci, Supplemental Figure 4 Ci–Ciii). Coated areas were evenly distributed along the entire length (40 mm) of the inflated PCBs (Figure 2 Aii–Cii), with MCEP displaying the highest percentage of coated area (94.3%), followed by MCN (91.7%) and IN.PACT (85.4%). Quantification of balloon residual drug post treatment (N=12/PCB) revealed significantly higher paclitaxel release from MCN (2.78 mg) compared to both IN.PACT (2.36 mg, P= 0.0027) and MCEP (2.46 mg, P= 0.0251). When combining results for MCN and MCEP, drug release from the microneedle coated PCB was 10% higher compared to IN.PACT (2.62 vs 2.36 mg, P= 0.0339). Notably, the amounts of released drug were uncorrelated with nominal doses (r=−0.016, P=0.926), and as detailed below they were not predictive of endoluminal coating distribution or tissue concentrations. Moreover, in vivo pilot studies comparing IN.PACT with an early variant of MCEP demonstrated that higher local paclitaxel release at the inflation site was not predictive of higher acute tissue concentration (Supplemental Table 1), implying that only a fraction of the locally released drug is transferred to the treated vessel, the rest presumably embolized downstream.
Figure 2.
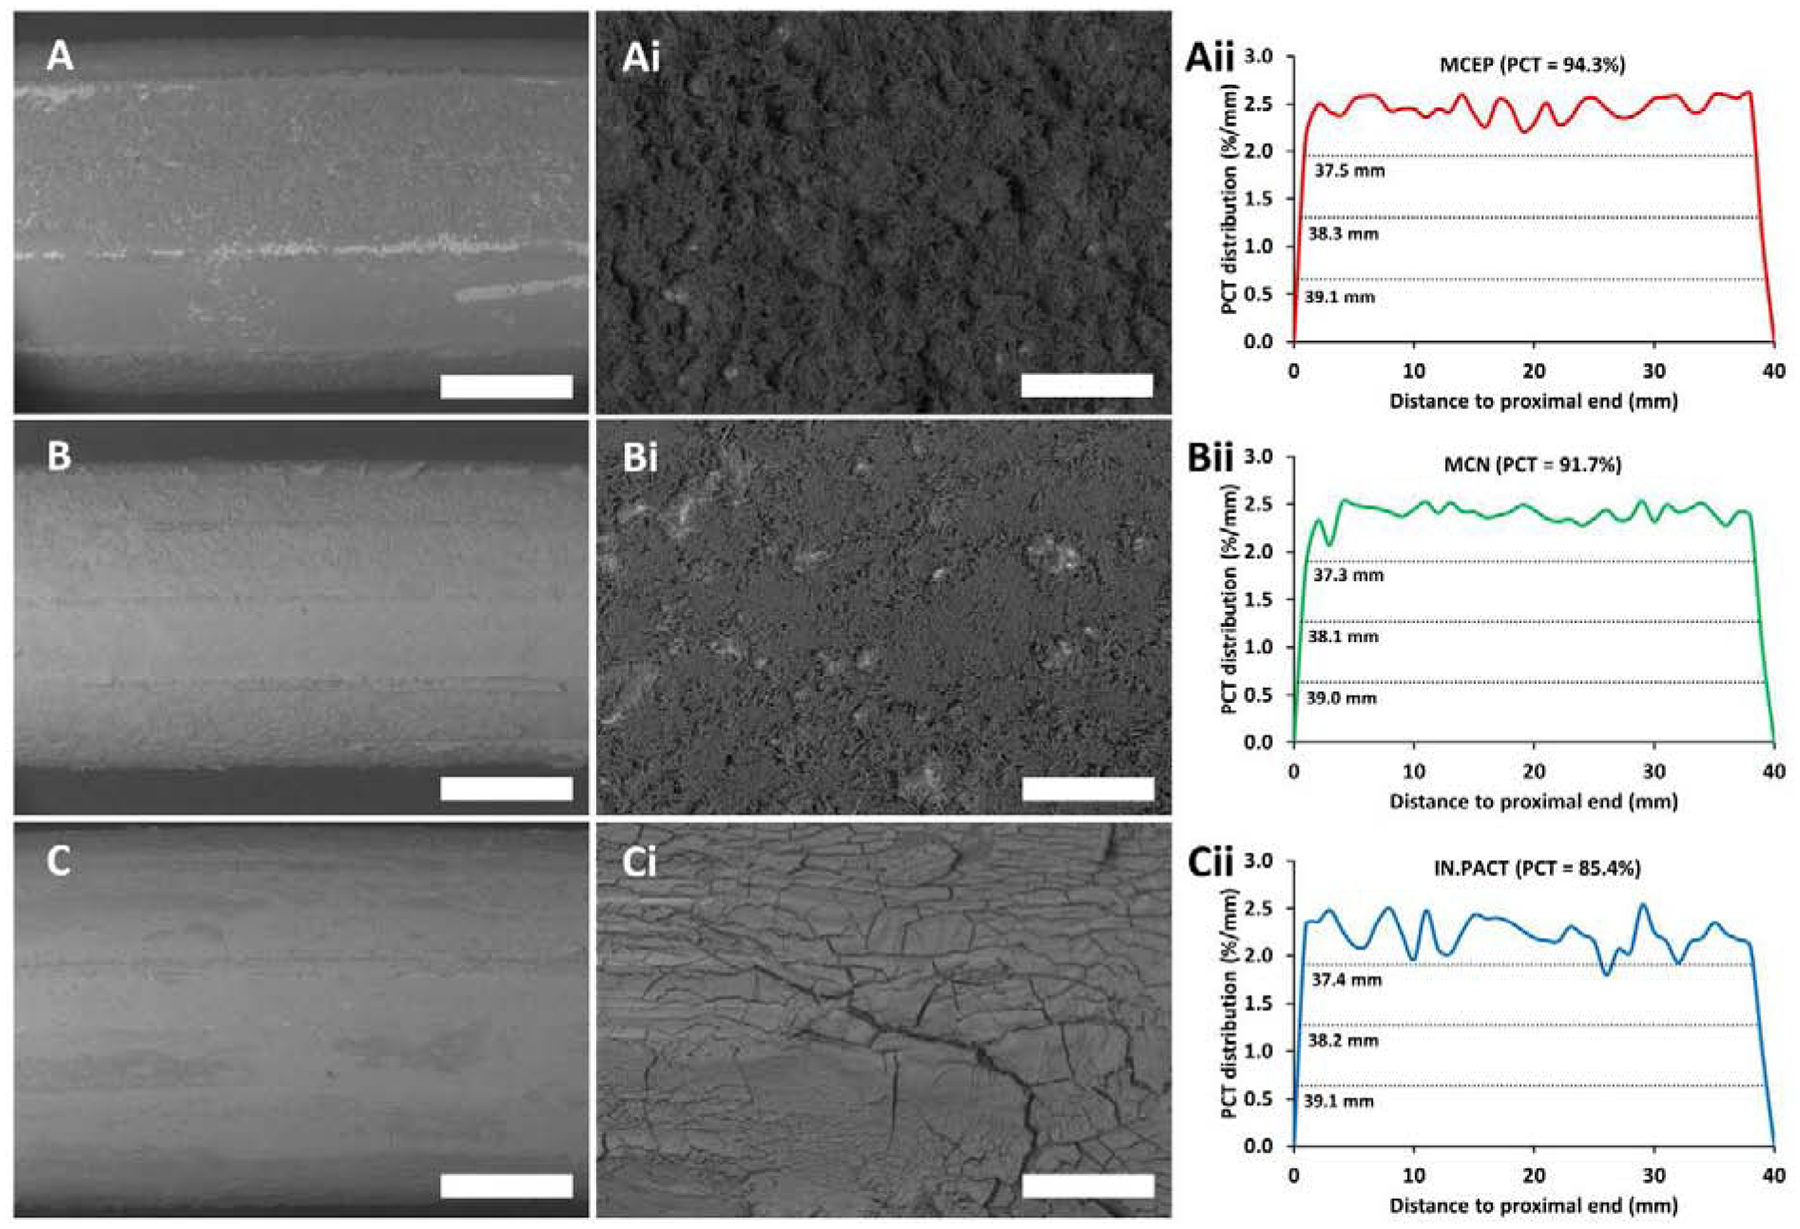
Coating distributions and micro-morphologies of air inflated PCBs. (A-C) Representative low magnification (15×) SEM images of mid-portions of MCEP (A), MCN (B) and IN.PACT (C), displaying gross coating distributions and morphologies (montages of the entire PCBs are depicted in Supplemental Figure 4 A–C). (Ai-Ci) High magnification (150×) resolution of coating micromorphologies in A-C. (Aii-Cii) Longitudinal coating distributions for MCEP (Aii), MCN (Bii) and IN.PACT (Cii) along the entire length of the same PCBs. Scale bar = 2 mm (A-C) / 200 μm (Ai-Ci).
3.2. Acute arterial coating distributions track microindentation pressures
Low magnification (20×) images of all arterial surfaces in the 0.5h group exhibited coating on all tissues and allowed for endoluminal mapping across the treated areas (Figure 3 A–C and Supplemental Figure 1). Overall, tissue coating was surprisingly sparse, with a maximal PCT of 29.1% in one of the MCEP treated vessels and mean PCTs < 18% for all PCB types. Higher magnification images revealed that most of the coating patches protruded above the arterial surface (Figure 3 Ai–Ci/Aii–Cii). However, some of the microneedle rich patches were visible within tissue microfolds or embedded into the tissue (Figure 3 Aiii–Biii) and some of the amorphous flakes appeared to be partially or fully tissue embedded (Figure 3 Ciii). Protruding coating greatly dominated over nonprotruding coating in all instances (Figure 3 D) and when averaged across all arteries, PCT of protruding coating was 23-fold that of nonprotruding coating (13.71 vs 0.59%, P<0.001). Notably, differences in total PCT were uncorrelated with either coating dose (r=0.414, P=0.181) or even release (r=0.012, P=0.970).
Figure 3.
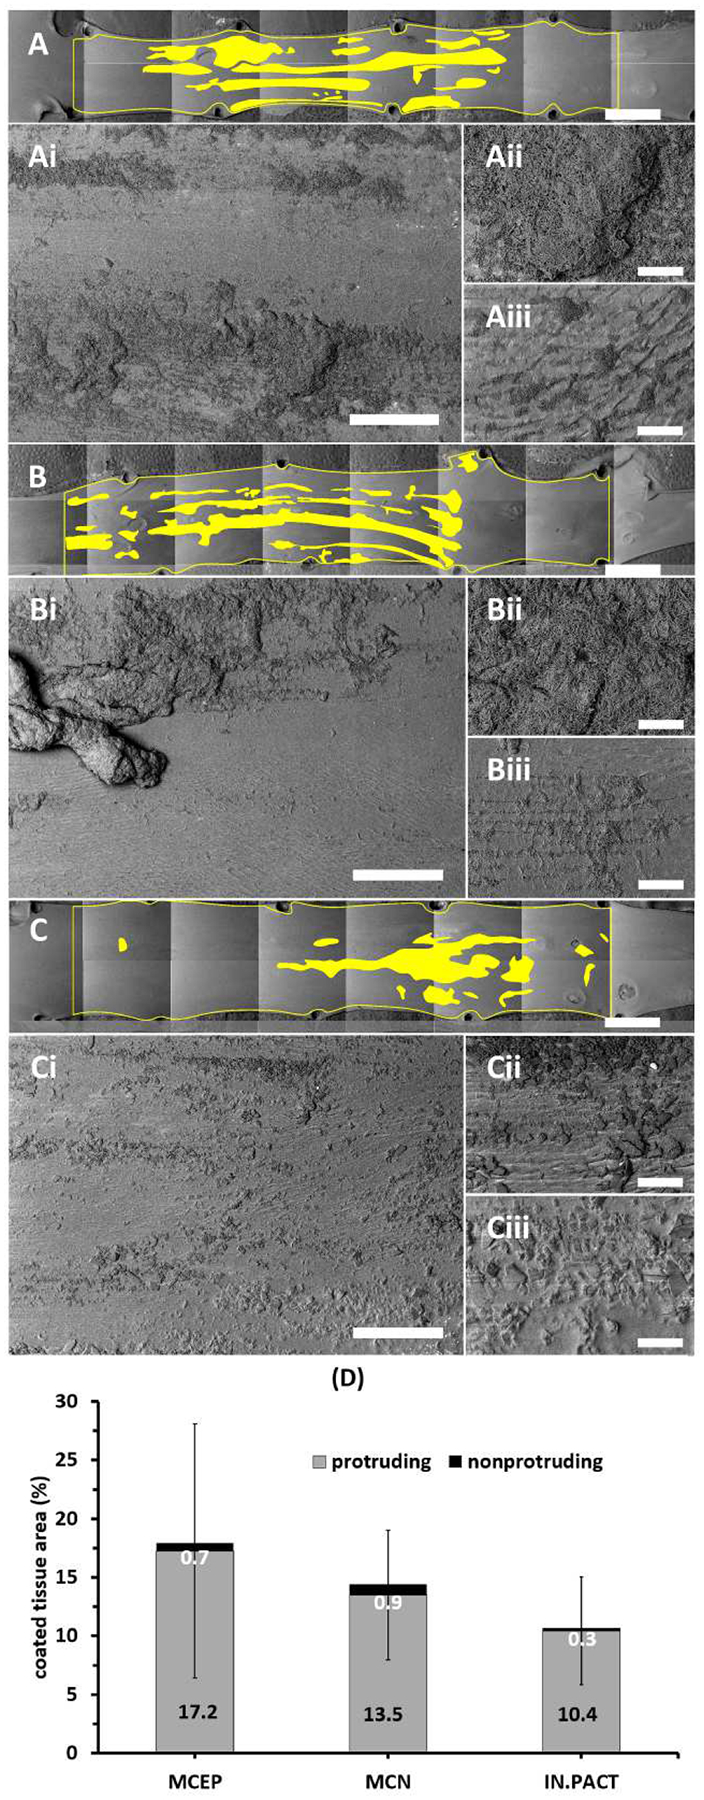
Surprisingly sparse coating distributions 0.5h post treatment. (A-C) Representative montaged 20× images of treated areas with coated areas highlighted by yellow masking post-treatment with MCEP (A), MCN (B) or IN.PACT (C). (Ai-Ci) All three PCBs transferred coating in clearly visible patches. At 50×, coating appeared to be predominantly surface protruding (Aii-Cii), though clusters of microneedles were visible in surface crevices (Aii-Bii) and some of the amorphous coating flakes were partially or fully embedded into the tissue surface (Ciii). Scale bar = 4 mm (A-C) / 500 μm (Ai-Ci) / 100 μm (Aii-Cii and Aiii-Ciii). (D) Device averaged PCT are dominated by protruding coating (values in black text). Enlarged versions of the high magnification images depicted in panels Aii-Cii and Aiii-Ciii are provided in Supplemental Figure 4.
Computation of longitudinal distributions of total observed coating (protruding + nonprotruding) along the treatment zones (Figure 4 A–C) facilitated a quantitative comparison between the treatment groups and between measured distributions, as well as correlation with computed microindentation pressures. On this scale, uniform coating delivery would be depicted as a 2.5%/mm step concentration across the 40 mm treatment zone (100%/40 mm). MCEP and MCN both delivered their microneedle coating in a near step-uniform fashion, though with coating absent from >25% (>10 mm) of the proximal and distal ends of the treatment zone (Figure 4 A–B). Delivery of the flaky coating by IN.PACT was even more focal and bell-shaped (Figure 4 C). This was captured by spread estimates at 25, 50 and 75% of the average peak, which were similar for MCEP and MCN and 1.7–3.0 fold larger than for IN.PACT (Figure 4 D). Visual inspection of all the arterial surface maps in their entirety confirmed that coating did not stray outside of the angiographic treatment zone, thereby ruling out geographic miss artifacts. Differences between the longitudinal distributions were significant by one way ANOVA (P=0.0001), with multiple comparisons revealing a significantly higher mean (e.g. PCT) for MCEP relative to MCN (+24.5%, P=0.0116) and relative to IN.PACT (+67.8%, P=0.0004). Longitudinal microneedle coating distribution, obtained by averaging MCEP and MCN distributions, exhibits a 1.5-fold larger mean relative to the flake/amorphous coating (P=0.0035). This was mirrored by a trend for 1.5-fold paclitaxel concentrations in tissue after treatments with microneedle coatings compared to flake/amorphous coating (1933 vs 1298 μg/g, P=0.1745).
Figure 4.
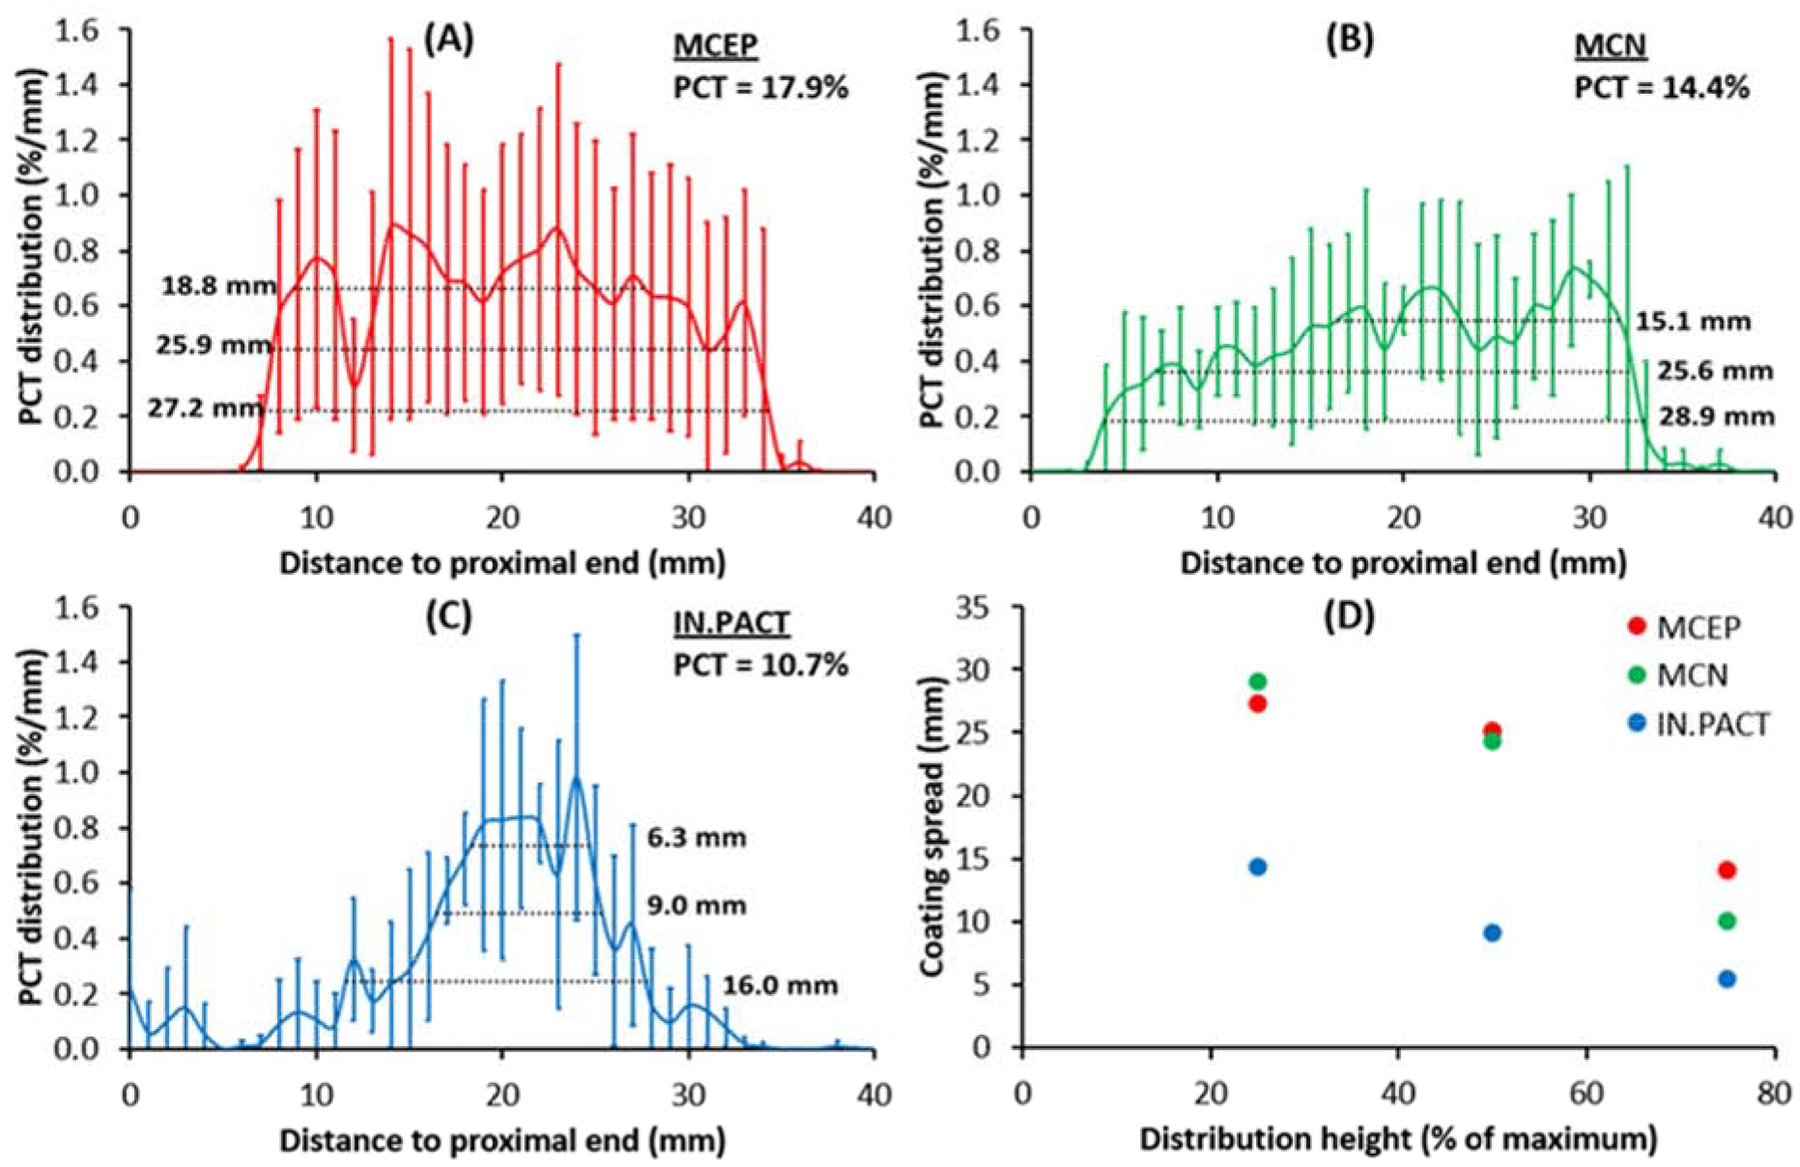
Longitudinal coating distributions 0.5h post treatment with MCEP (A), MCN (B) or IN.PACT (C). Solid curves represent the average distributions for each PCB, and inserts list the corresponding PCT and spreads at 25, 50 and 75% of the respective distribution maxima. (D) MCEP and MCN consistently delivered their coating to a wider area than IN.PACT.
Computational modeling related the longitudinal coating distributions to the coating microparticle dependent transmission of angioplasty contact pressure (Figure 5 A, B). The estimate (Eq. 1) implies that disk/flakes released by IN.PACT only transmit ~80% of the applied angioplasty pressure P, and is confirmed by the simulation results depicted in Figure 5 C (solid lines vs dashes). On the contrary, the estimate (Eq. 2) implies that microneedles attenuate angioplasty pressures in excess of Part and amplify those smaller than Part. Though ~8 atmospheres (~800 kPa) were used to inflate the PCB, the peak computed radial contact pressure (5.6 kPa) is ~140-fold smaller as most of the force is expended in circumferential and lateral stretching of the treated arterial segment. Moreover, the computed radial angioplasty contact pressure was bell-shaped, extending across ~70% (27mm) of the treated segment (dashes in Figure 5 C, D). This prediction was obtained by averaging four simulations with an overstretch range of 1–16%, matching the measured overstretch in the 0.5h group (8±7%). Review of each of these and additional simulations (Supplemental Figure 6) revealed that balloon-artery contact increases with increasing overstretch, with full contact and spatially uniform contact pressure distributions at overstretches of 18% and above.
Figure 5.
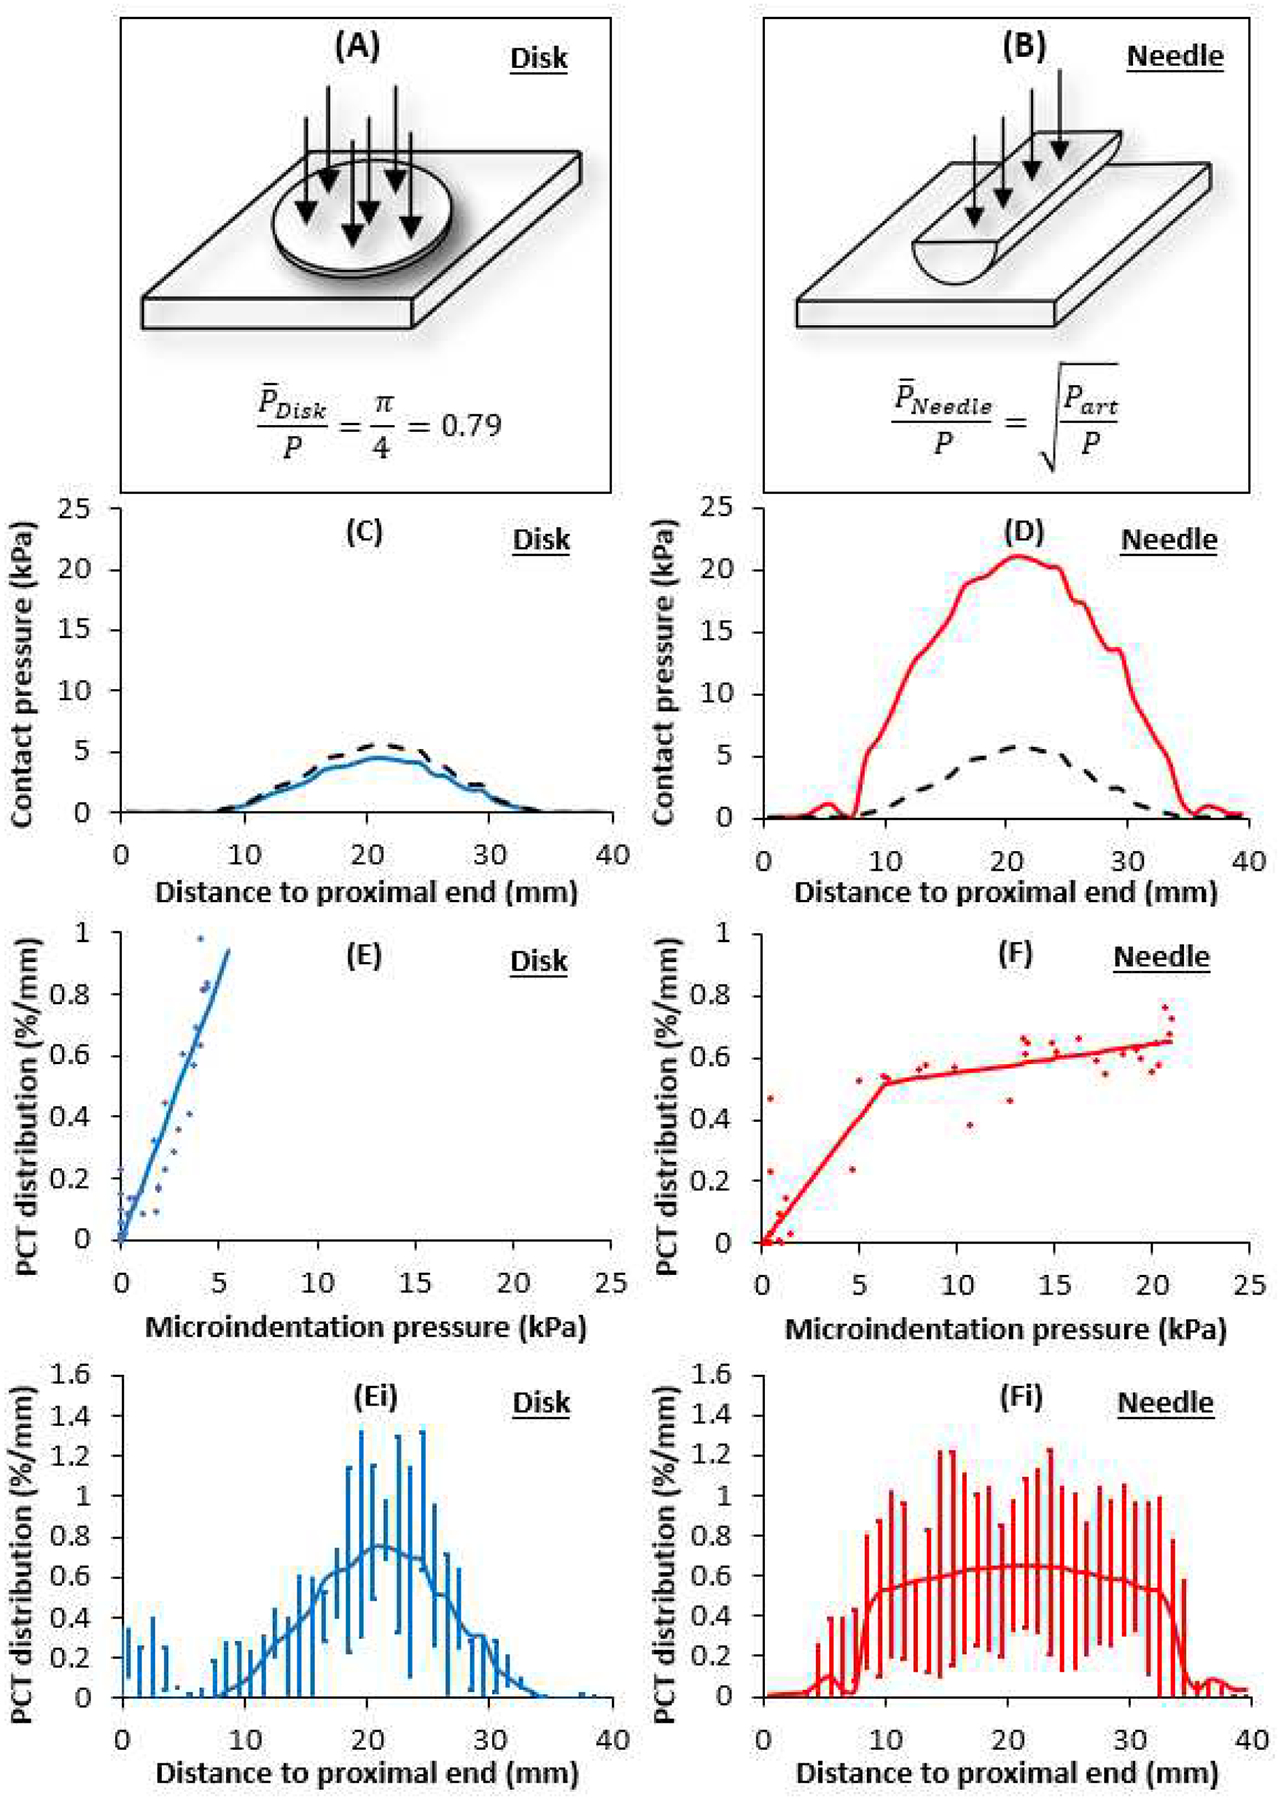
Coating morphology dictates contact pressures and delivery distributions. (A, B) Schematic representation of the microgeometry used to evaluate microscopic contract stresses exerted by disk shaped (C) and needle (D) coating particles. Dashes denote the mean macroscopic contact pressure predicted by the balloon angioplasty model. (E) Diamonds: mean PCT per unit length for the disk/flake (from Fig 4C) plotted against the corresponding microindentation pressure (from panel C) at the same distance from the proximal end. Solid line depicts best fit line with zero intercept and slope= 0.171 %/mm/kPa (R2=0.8690). (Ei) Computed PCT distribution based on panel C and the linear fit from panel E. (F) Diamonds: mean PCT per unit length for the needle coatings (from Fig 4 D, E) plotted against the corresponding microindentation pressure (from panel D) at the same distance from the proximal end. Solid line depicts segment linear fit (Eq. 3) with Slope 1= 0.083 %/mm/kPa, Slope 2= 0.009 %/mm/kPa and threshold pressure for slope change, p0=6.3 kPa (R2=0.8614). (Fi) Computed PCT distribution based on panel D and the segment linear fit from panel F.
Given that Part =78.4 kPa is 15-fold the computed peak angioplasty pressure, we find that microneedles always amplify applied angioplasty pressures (Figure 5 D). Notably, the predicted microindentation contact pressure distributions for the disk/flake coatings (Figure 5 C) is tightly correlated (r=0.933, P<0.001) with the measured PCT distributions for IN.PACT (Figure 4 C), and that of the microneedles (Figure 5 D) is tightly correlated (r=0.865, P<0.001) with the measured PCT distributions of MCEP (Figure 4 A) and MCN (Figure 4 B). This is strikingly visualized when overlaying the respective normalized microindentation pressure and distributions and coating distributions (Supplemental Figure 7), suggesting a proportional tracking. Plotting of the longitudinal PCT distribution of the disk/flake coating confirmed proportional tracking of the computed microindentation pressure (Figure 5 E) with a slope of 0.171 %/mm/kPa (R2=0.8690). Thus, the shape of the PCT distribution for the disk/flake coating (Figure 5 Ei) is the same as the associated microindentation pressure distribution (Figure 5 C). The longitudinal distribution of the microneedle coating also proportionally tracked its associated microindentation pressure over the same dynamic range (Figure 5 F) though at a 2-fold lower rate compared to disk coating (0.083 %/mm/kPa); moreover, for microindentation pressures in excess of 6.3 kPa the rate of increase in coating distribution dropped ~9-fold (Eq. 3, R2=0.8614). Consequently, the measured shape of the PCT distribution for the microneedle coating (Figure 5 Fi) only tracks the proximal and distal shoulders of computed microindentation pressure distribution (Figure 5 D); between these shoulders, the PCT distribution is near constant.
3.3. Arterial drug retention and coating distribution 24–72h post-treatment
By 24h, observable coating was confined to a handful of small patches along the vessel surface with no specific visual pattern (Figure 6 A–C), corresponding to significant PCT declines by >93% for all PCB types (MCEP: −93.6%, P=0.0112; MCN: −96.0%, P=0.0005; IN.PACT, −97.7%, P=0.0009). Notably, high magnification imaging did not reveal coating patches that protrude above the tissue surface (Figure 6 Ai–Ci/Aii–Cii). Rather, microneedle clusters were visible in tissue crevices (Figure 6 Ai) or covered by a thin intimal layer (Figure 6 Bi, Aii–Bii), whereas amorphous flakes appeared to be partially (Figure 6 Ci) or fully tissue embedded (Figure 6 Ciii). Similar to 0.5h, PCT at 24h trended higher for microneedle coatings compared to the amorphous/flaky coating (Figure 6 D). While total PCT declined precipitously between 0.5 and 24h, nonprutruding PCT trended 8.6% lower for the disk/flaky coating (P=0.9947), 37.5% lower for MCN (P=0.7234) and actually trended 68.4% higher for MCEP (P= 0.6694).
Figure 6.
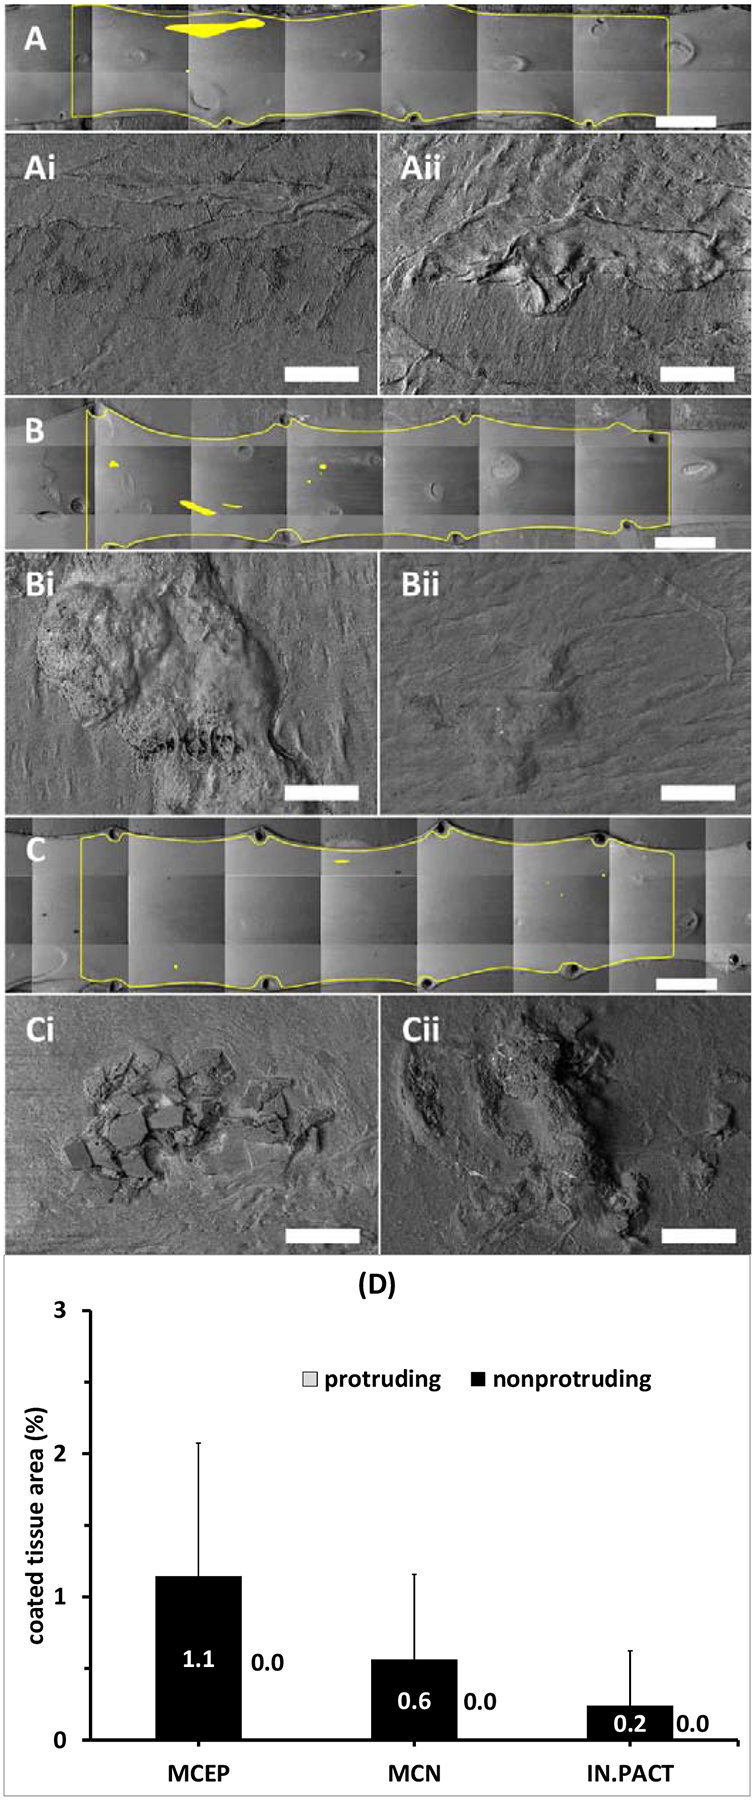
Coating distributions 24h post-treatment. (A-C) Representative montaged 20× images of treated areas with coated areas highlighted by yellow masking 24h post treatment with the MCEP (A), MCN (B) or IN.PACT (C). All three PCBs displayed isolated small coating clusters. At 250× magnifications coating appeared to be partially embedded into the tissue (Ai-Ci) or completely covered by a thin intimal layer (Aii-Cii). Scale bar = 4 mm (A-C) / 100 μm (Ai-Ci and Aii-Cii). (D) Average PCT 24h post treatment are dominated by nonprotruding coating (values in white text).
Imaging confirmed little qualitative change in detectable tissue coating distributions between 24 and 72h (Figure 7 A–C), and though PCT levels trended lower between 24 and 72h for each of the PCB, these declines of 60.1% for MCEP, 73.9%, for MCN and 6% for IN.PACT were far from being statistically significant (P>0.98). Isolated coating particles were still observed along the vessel (Figure 7 Ai–Ci) and classified as tissue embedded (Figure 7 Aii–Cii). Similar to 0.5 and 24h, PCT at 72h trended higher for MCEP compared to the amorphous/flaky coating (Figure 7 D), though statistical significance was not attained in any of these time points separately. Statistical significance was attained when nonprotruding coating levels at 0.5, 24 and 72h were pooled, with, respectively, MCEP and microneedle (e.g. the average of MCEP and MCN) exhibiting 3.1- (0.75%, P=0.0446) and 2.7-fold (0.64%, P=0.0195) higher levels compared to the disk/flaky coating (0.24%).
Figure 7.
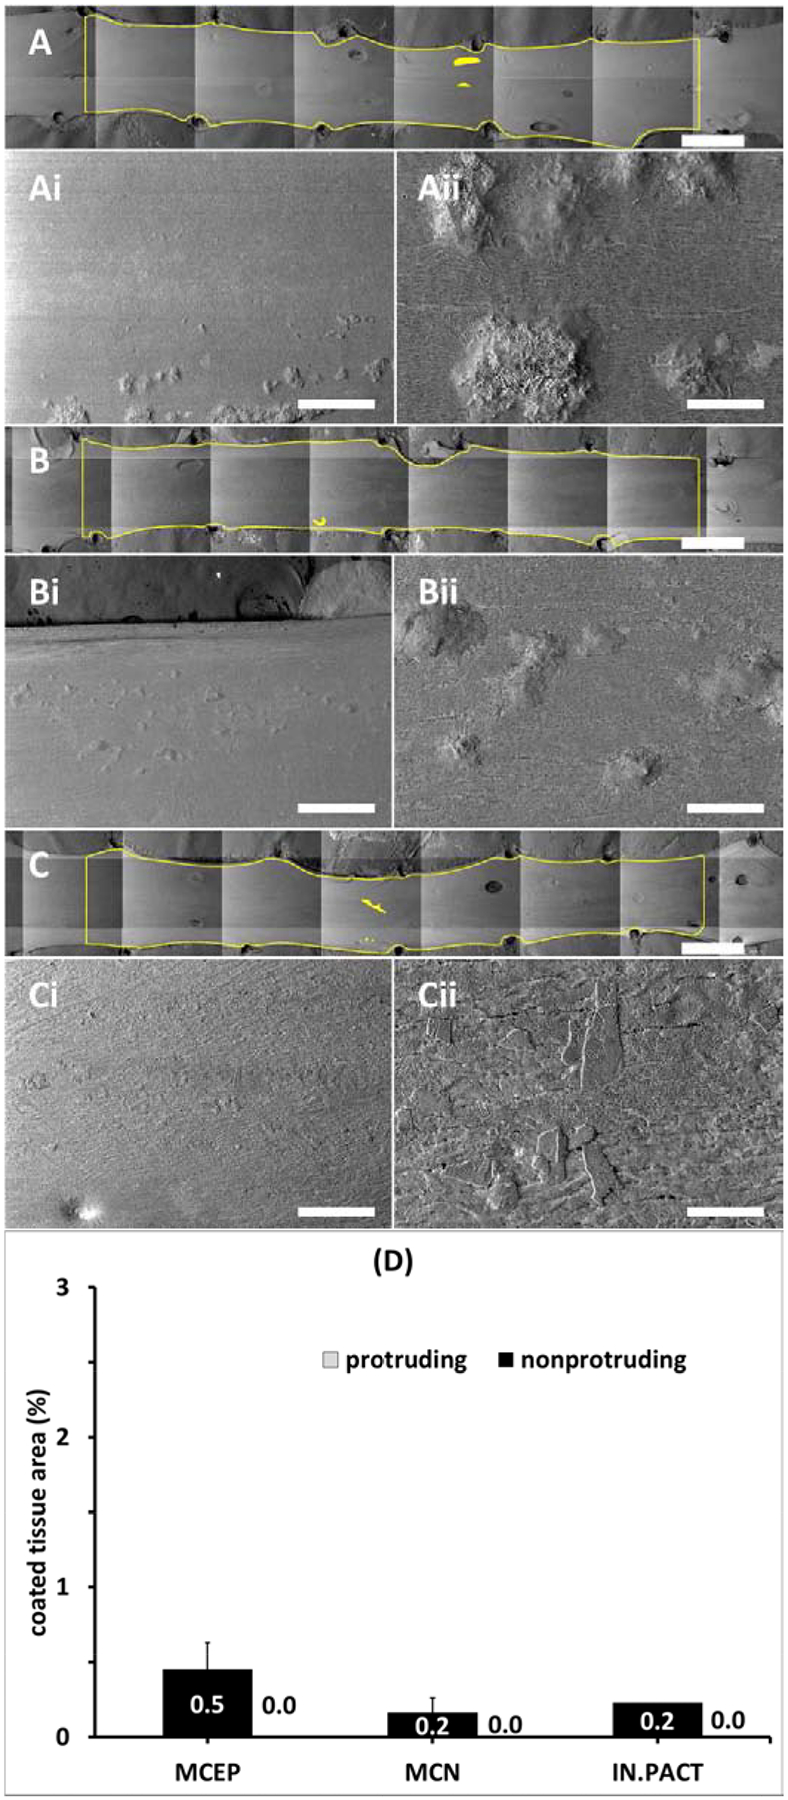
Coating distributions 72h post-treatment. (A-C) Representative montaged 20× images of treated areas with coated areas highlighted by yellow masking 72h post treatment with the MCEP (A), MCN (B) or IN.PACT (C). All three PCBs displayed isolated small coating clusters at 50× magnification (Ai-Ci). Higher magnification (250×) revealed clusters of embedded microneedle (Aii-Bii) and partially embedded amorphous flakes (Cii). Scale bar = 4 mm (A-C) / 500 μm (Ai-Ci) / 100 μm (Aii-Cii). (D) Average PCT 72h post treatment are dominated by nonprotruding coating (values in white text).
The time dependent variations of nonprotruding PCT and total PCT per PCB are depicted, respectively, in Figure 8 A–B. Notably, total PCT values were mirrored by paclitaxel concentrations in the same arteries with a notable overall correlation (r=0.895, P<0.001) across devices and time points that lends quantitative relevance to PCT estimates. Mirroring PCT, tissue concentrations also decreased significantly by >93% between 0.5 and 24h (MCEP: −93.5%, P=0.0103; MCN: −97.0%, P=0.0012; IN.PACT: −97.0%, P=0.0003), while decreasing insignificantly (P>0.99) between 24–72h (Figure 8 C). Tissue concentrations trended higher for MCEP compared to both IN.PACT and MCN at 24 and 72h. However, pooling of 24 and 72h data revealed a significant 2.2-fold higher concentration after MCEP compared to IN.PACT (90.03 vs 39.9 ng/mg, P= 0.0252), with MCN trending between the two extremes (56.27 ng/mg). Differences between devices could not be attributed to differences in dose or release, as at none of the time points did paclitaxel tissue concentration correlate with treating PCB doses (0.5h: r=0.016, P=0.9597; 24h: r=0.375, P=0.2291; 72h: r=0.647, P=0.0169) or net drug release (0.5h: r=0.434, P=0.1582; 24h: r=0.123, P=0.7039; 72h: r=−0.236, P=0.4368).
Figure 8.
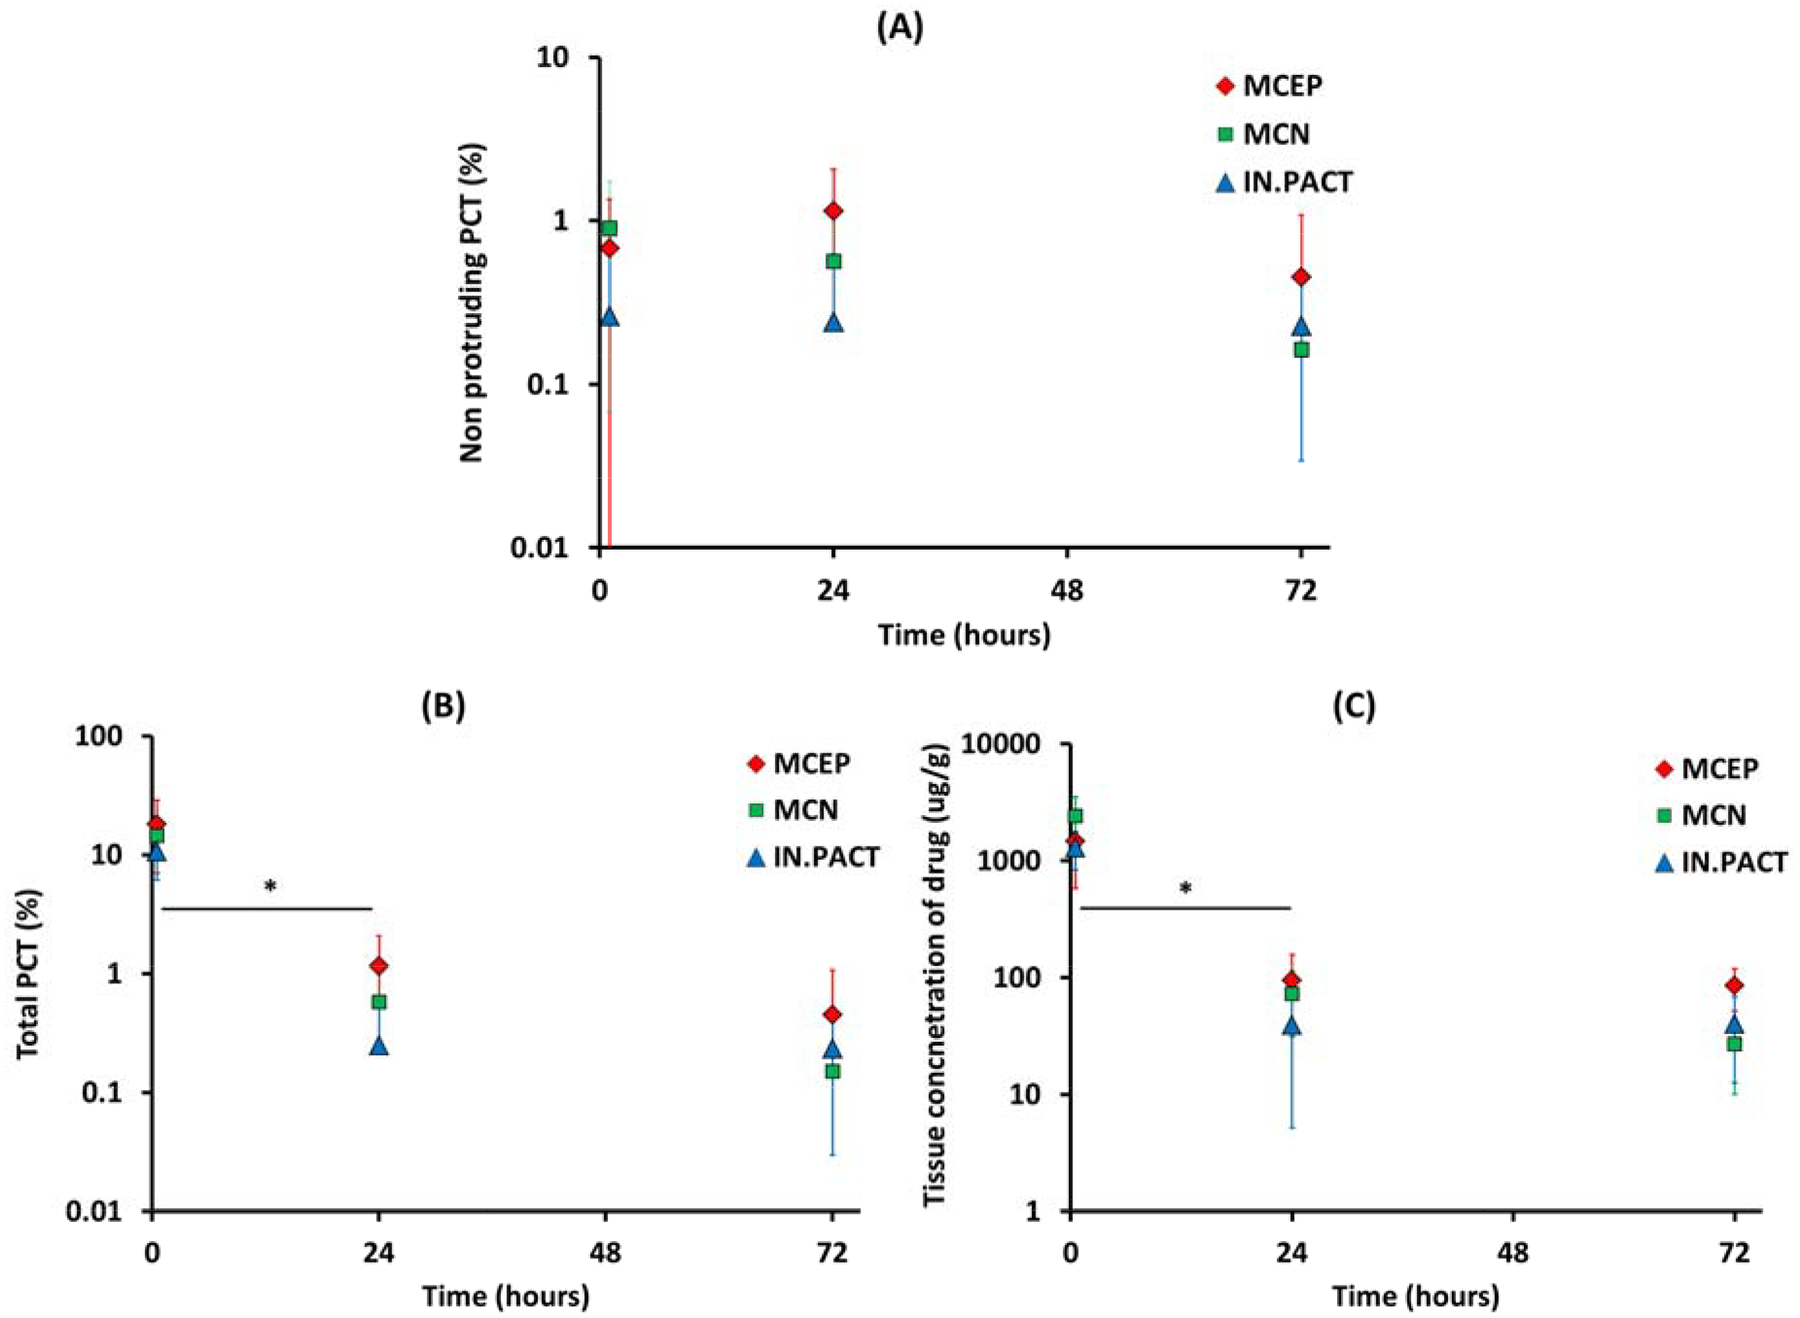
Kinetics of PCT and drug concentration. Non protruding PCT levels vary slowly between 0.5 and 72h (A), whereas the total PCT (B) and the concentration of paclitaxel in the tissue (C) both exhibit a statistically significant (*) early decline after MCEP (red), MCN (green) and IN.PACT (blue) treatments.
4. Discussion
Drug coated balloons deliver drug via coating delivery rather than by drug elution, with coating particles acting as local drug depots, releasing drug at a rate determined by their dissolution18, 29. Development of safer, more efficacious and predictable coating delivery devices therefore requires the introduction of novel methodologies to define and predict the local tissue distribution of coating particles. The current study was designed to address this need and is the first to quantitatively measure endoluminal coating distribution after DCB treatments using a novel SEM-based approach, while also capturing the micromorphology and embedding state. Contrary to the belief that balloons distribute drug uniformly on the vessel surface, our images show that average tissue coverage (PCT) per device was <18% in all cases. Moreover, PCT values tightly correlated (r=0.895, P<0.001) with LC-MS/MS measured paclitaxel concentrations in the same samples (Figure 8 B vs C). Thus, SEM images of treated arteries provided a novel quantitative readout for testing the determinants of acute coating transfer to the artery and drug retention up to 72h.
4.1. Coating transfer is dictated by microindentation pressures
Imaging of all 3 PCB types revealed a near uniform coating along their full 40 mm untapered length (Figure 2), yet none transferred their coating uniformly across the treated arterial segment (Figure 3 and 4). Indeed, despite the employment of angiographic guidance and two balloon diameters to account for variable arterial diameters and taper, coating never distributed to >30 mm of the treatment length with spread being especially limited for the flaky coating PCB. While 17.8±3.6% of the flaky coating is lost during vascular tracking in the same porcine model (Supplemental Table 1), there is no reason for such loss to be enhanced in the proximal and distal portions of the PCB, and indeed, our own images of the IN.PACT coating prior and post dry inflation revealed an apparent uniform distribution of cracks. The question then is what predicts local coating transfer to the wall, adherence and penetration?
The 0.5h data demonstrate that coating micromorphology, e.g. the shape of the coating microparticles that are locally transferred to the artery wall play a key role. Namely, 0.5h post PCB treatment, arteries treated with MCEP and MCN exhibited higher acute tissue concentrations and PCT compared to IN.PACT. When combining the data for MCEP and MCN, arteries treated with microneedle coatings exhibited 1.5-fold higher tissue concentrations (P=0.1745) as well as 1.5-fold higher PCT (P=0.0035) compared to those treated with amorphous/flaky coating, while displaying 1.7–3.0 wider longitudinal distribution (Figure 4D). While we cannot with absolute certainty dismiss the possibility that these trends arise from enhanced loss of the flaky coating in blood, this is unlikely for two reasons. First as higher transfer reflects more spatially extended transfer along the lesion, and second as early pilot studies comparing IN.PACT with an early variant of MCEP demonstrated significantly greater vascular tracking loss for the latter (P< 0.0001), but also a trend for higher tissue concentration 1h post treatment (Supplemental Table 1).
The importance of coating micromorphology in determining paclitaxel transfer to the subjacent tissue had previously only been demonstrated in vitro. Indeed, paclitaxel transfer from uniaxially compressed flat nylon PCB coupons onto flat arterial tissue coupons did exhibit a dependence on coating micromorphology and exerted pressure that was consistent with contact mechanics theory25. By coupling the classical contact mechanics formulation that accounts for coating particle shape to a computational angioplasty model, the current study was able to compellingly correlate (r=0.9, P<0.001) acute in vivo coating transfer distributions with the local microindentation pressures exerted on the subjacent intima (Figure 5 E–F). These microindentation pressures are a resultant of a complex interplay between inflation pressure, coating microparticle shape and tissue stiffness. The current study controlled for tissue stiffness via treatment of naive femoral arteries from similarly aged Yorkshire swine, thereby highlighting longitudinal angioplasty pressure gradients and their differential transmission based on coating micromorphology. Longitudinal angioplasty contact pressure gradients at overstretch can arise if the balloon is inflated to sub-nominal diameters, as there is then no guarantee that lateral unfolding and contact develop to the same degree as in the middle of the treated lesion (Supplemental Figure 6). Coating morphologies, such as microneedles, that can amplify lower lateral pressures (Figure 5D) are less sensitive to these inhomogeneities than those that simply transmit or attenuate the local radial pressures exerted by the balloon (Figure 5C). Thus, flaky-coating PCB will be more sensitive to local variations in angioplasty pressure owing to sub-angiographic gradients in balloon apposition, as demonstrated in this study, or to gradients in tissue stiffness owing to compositional variations. Indeed, Speck et al reported higher transfer of paclitaxel from amorphous/flaky coated PCB into the arterial wall of adult minipigs compared with young domestic pigs and speculatively attributed this to age-related arterial stiffening, which results in higher pressure during drug release19.
Diseased lesions exhibit two primary complexities not considered in our study, e.g. variable stenosis and compositional heterogeneity, with hematoma, fatty and fibrous areas exhibiting reduced stiffness compared to native media30, 31, fibro-calcific areas exhibiting a ~3-fold increase and calcified inclusions exhibiting a 1000-fold increase30. Thus, disease is expected to elevate local coating transfer in some contexts and reduce it in others, and indeed both findings have been reported in rabbit models of atherosclerosis. Thus, Fernandez-Parra et al.32 reported a significant 3.5-fold increase in paclitaxel levels in atheromatous compared to pre-atheromatous and native arteries, perhaps due to increased stiffness though stenosis may have also contributed to this finding owing to increased local contact pressures. In contrast, Stolenburg et al.33 using a different method to induce lesions in rabbit arteries reported a significant 2.2-fold reduction in acute paclitaxel transfer to the lesions compared to the native rabbit arteries, likely due to the lesions being soft compared to native arteries. This inference is consistent with the idea that increasing the inflation pressure resulted in a significant increase in paclitaxel transfer to atheromatous but not native arteries. Namely, as the microindentation pressure is gradually increased from zero, coating adhesion appears to increase proportionally as coating particles contact a larger tissue area and the van der Waals force of adhesion increases34. However, this trend appears to taper at some threshold pressure, which for naïve porcine arteries appears to be in the range of 6 kPa, at least for microneedle coatings (Figure 5 E). Increasing the microindentation pressure beyond this threshold may be more important for enhancing retention through tissue embedment of coating microparticles. However, a full consideration of the effects of disease would require additional experimental testing and the development of a more refined three dimensional virtual angioplasty model.
4.2. Coating microstructure and embedding determine tissue retention
Preclinical PCB studies have long reported fast clearance of acute drug concentrations10, 19 raising questions as to the determinants of late retention in PCB treated arteries as well as to the therapeutic relevance of a fast cleared drug pools in the tissue. Indeed, fast clearance of a large fraction of balloon transferred drug from the treated tissue may at least partially explain the relative success of paclitaxel over other drugs such as sirolimus, as paclitaxel is almost unique in its ability to inhibit vascular cell migration and proliferation for more than a week after 20 minutes of in vitro exposure5. Thus, understanding the determinants of drug retention after drug coated balloon treatment is even more important for technologies utilizing sirolimus analogs.
Our recent computational modeling study18 that accounted for dissolution of both surface adherent and tissue embedded paclitaxel coating, diffusion, nonspecific extracellular binding and intracellular binding to microtubules was consistent with, but could not prove, that paclitaxel retention in healthy pig arteries over the course of weeks to months is determined by the slow dissolution of the tissue embedded coating and slow dissociation of microtubule bound drug. The temporal correlation of SEM imaging and tissue concentration measurements in the current study provided the first experimental demonstration for the critical contribution of tissue-embedded coating to paclitaxel retention, at least up to 72h post treatment.
The significant >93% decline in tissue concentrations (P<0.05) between 0.5 and 24h in our study, coincided with a >93% in total PCT. This decline reflected the clearance of luminally protruding coating which was dominant at 0.5h (Figure 3D) but virtually absent at 24h (Figure 6D) and 72h (Figure 7D). Thus, endoluminally protruding coating is fast clearing relative to noprotruding coating, implying that the latter determines retention. Such embedding seems to arise both from acute embedment of coating particles during balloon inflation (Figure 3 Ciii), as well as from fibrin coverage during the first 24–72h of nonprotruding coating as part of the normal scaring response. Prior histological studies had sporadically noted the distribution of coating particles into the intima, but without being able to quantify the amount of this coating pool or to correlate it with retention. By the same token, preclinical scraping studies reported differential paclitaxel clearance rates from intact vessels versus the scrapable endoluminal layer11. Yet such scraping studies are prone to variability and are unable to resolve the fractions of coating versus tissue associated drug.
SEM imaging of arterial surfaces also suggested a dependence of embedment on coating micromorphology as nonprotruding coating levels trended higher for MCEP vs flakes, across all time points (Figures 3 D, 6 D, 7 D). Porosity of the substrate onto which the drug coating is applied may also play a role as MCN only showed superiority at 0.5 and 24h. Statistical significance was achieved when nonprotruding coating levels at 0.5, 24 and 72h were combined, with MCEP and microneedle (e.g. the average of MCEP and MCN) exhibiting, respectively, 3.1- (P=0.0446) and 2.7-fold (P=0.0195) higher levels compared to the disk/flaky coating. Such enhanced embedment of microneedle relative to the disk/flaky coating would be expected given the greater microindentation pressures they exert on the tissue. The dominance of protruding coating over nonprotruding coating is also consistent with pressure-dependent coating transfer, though of course, the bottom layer of a protruding coating patch may actually be embedded.
A scaling of tissue embedment with microindentation pressures would then also imply that the amount and distribution of tissue-embedded coating may also depend on local disease and injury, as these modulate local stiffness and permeability. Indeed, this may explain the reduced efficacy of PCB with the length and arc of arterial calcification17, as while coating transfer to such stiff lesions may be noninferior to healthy animal arteries, the elevated stiffness of calcified regions will tend to impede coating embedding and with it sustained drug retention and biological efficacy. This defines the opportunity for vessel preparation via balloon predilatation, scoring, cutting balloons or atherectomy devices as a means of enhancing drug retention, in addition to enhancing coating transfer and acute drug levels.
4.3. Limitations
Surface imaging by SEM cannot visualize subintimal coating or dissolved drug not associated with coating. However, the significant correlation between imaging and tissue concentrations suggests that these two limitations do not apply at 0.5–72h. The use of an axisymmetric computational model to predict angioplasty and microindentation pressures introduces approximations that can and should be relaxed in future studies, particularly in the setting of axisymmetric diseased lesions. However, the good correlation with measured longitudinal coating distributions obtained in the current study, suggest that this model captures the essential role of contact pressure in determining coating transfer to naïve arteries, with only minor quantitative errors. As with any preclinical study employing healthy animals, it is difficult to extrapolate quantitative findings to the clinical settings Nevertheless, as discussed above the key insights are expected to hold, e.g. the association of late retention with the pool of tissue-embedded coating and the dependence of coating transfer on the microindentation contact pressure. Moreover, the dependence of the microindentation pressure on arterial stiffness holds the key to the eventual extrapolation of the current findings to more complex and clinically relevant lesions.
4.4. Translational Perspective
Drug coated balloons have shown efficacy in treating femoropopliteal disease, but results have been variable and thought to reflect variabilities in arterial drug distribution. While several PCB have been cleared by the FDA, the field was thrown into confusion with the publication of a meta-analysis of randomized peripheral artery safety trials reported a statistically significant dose dependent mortality signal for PCBs and paclitaxel coated stents compared to uncoated control devices, though no causal mechanism was offered35. A patient level analysis of the same data which we recently coauthored36 identified a weaker mortality signal than was initially reported and no dose response, while other meta-analyses found no mortality signal in femoropopliteal interventions37, 38, or even improved safety after coronary interventions39. Despite some abatement of concerns surrounding the use of paclitaxel, the need for better understanding of these devices’ mode of action, and dependence on drug and coating morphology remains. In particular, safety concerns have emphasized the need to maximize local delivery and minimize downstream embolization40, for paclitaxel or any other drug. Such concerns provide important context to our demonstrations of acute coating transfer to <20% of the endoluminal surface and <75% of its length and the inference that only coating that is partially embedded into the wall contributed to sustained drug retention. Moreover, the data suggest that microcrystalline coatings that amplify local angioplasty pressures result in improved transfer and a trend for enhanced drug retention, emphasizing not only the importance of coating micromorphology but also of procedural parameters and novel balloon designs41 that can enhance coating-tissue contact pressure. Hopefully, these insights and the computational-experimental methodology from which they derive can help accelerate the development of newer designs of drug coated balloons that optimize drug targeting, efficacy and safety.
Supplementary Material
Acknowledgments
This study was supported in part by an NIH grant (R01 GM-49039) to Dr Edelman and research grants from W.L. Gore & Associates Inc. (Flagstaff, AZ) to CBSET.
Abbreviations
- iFEM
inverse finite element method
- DCB
drug coated balloon
- LC-MS/MS
high-performance liquid chromatography with tandem mass spectrometry
- MCN
microcrystalline on nylon
- MCEP
microcrystalline on ePTFE
- PCB
paclitaxel coated balloon
- PCT
percent coated tissue
- SEM
scanning electron microscopy
Footnotes
Publisher's Disclaimer: This is a PDF file of an unedited manuscript that has been accepted for publication. As a service to our customers we are providing this early version of the manuscript. The manuscript will undergo copyediting, typesetting, and review of the resulting proof before it is published in its final form. Please note that during the production process errors may be discovered which could affect the content, and all legal disclaimers that apply to the journal pertain.
Disclosures
Steve Alston is an employee of W.L. Gore & Associates Inc. (Flagstaff, AZ).
Data statement
Supporting data are available from the corresponding author on reasonable request. Some of the raw/processed data required to reproduce these findings cannot be shared at this time due to legal, technical or time limitations.
Declaration of interests
The authors declare that they have no known competing financial interests or personal relationships that could have appeared to influence the work reported in this paper.
5. References
- 1.Laird JA, Schneider PA, Jaff MR, Brodmann M, Zeller T, Metzger DC, Krishnan P, Scheinert D, Micari A, Wang H, Masters M, Tepe G. Long-term clinical effectiveness of a drug-coated balloon for the treatment of femoropopliteal lesions. Circ Cardiovasc Interv. 2019;12:e007702. [DOI] [PMC free article] [PubMed] [Google Scholar]
- 2.Drachman DE, Edelman ER, Seifert P, Groothuis AR, Bornstein DA, Kamath KR, Palasis M, Yang D, Nott SH, Rogers C. Neointimal thickening after stent delivery of paclitaxel: Change in composition and arrest of growth over six months. Journal of the American College of Cardiology. 2000;36:2325–2332 [DOI] [PubMed] [Google Scholar]
- 3.Creel CJ, Lovich MA, Edelman ER. Arterial paclitaxel distribution and deposition. Circ Res. 2000;86:879–884 [DOI] [PubMed] [Google Scholar]
- 4.Levin AD, Vukmirovic N, Hwang CW, Edelman ER. Specific binding to intracellular proteins determines arterial transport properties for rapamycin and paclitaxel. Proc Natl Acad Sci U S A. 2004;101:9463–9467 [DOI] [PMC free article] [PubMed] [Google Scholar]
- 5.Axel DI, Kunert W, Goggelmann C, Oberhoff M, Herdeg C, Kuttner A, Wild DH, Brehm BR, Riessen R, Koveker G, Karsch KR. Paclitaxel inhibits arterial smooth muscle cell proliferation and migration in vitro and in vivo using local drug delivery. Circulation. 1997;96:636–645 [DOI] [PubMed] [Google Scholar]
- 6.Scheller B, Speck U, Abramjuk C, Bernhardt U, Bohm M, Nickenig G. Paclitaxel balloon coating, a novel method for prevention and therapy of restenosis. Circulation. 2004;110:810–814 [DOI] [PubMed] [Google Scholar]
- 7.Speck U, Stolzenburg N, Peters D, Scheller B. How does a drug-coated balloon work? Overview about coating technologies and their impact. J Cardiovasc Surg (Torino). 2015 [PubMed] [Google Scholar]
- 8.Cortese B, Granada JF, Scheller B, Schneider PA, Tepe G, Scheinert D, Garcia L, Stabile E, Alfonso F, Ansel G, Zeller T. Drug-coated balloon treatment for lower extremity vascular disease intervention: An international positioning document. Eur Heart J. 2016;37:1096–1103 [DOI] [PubMed] [Google Scholar]
- 9.Kelsch B, Scheller B, Biedermann M, Clever YP, Schaffner S, Mahnkopf D, Speck U, Cremers B. Dose response to paclitaxel-coated balloon catheters in the porcine coronary overstretch and stent implantation model. Invest Radiol. 2011;46:255–263 [DOI] [PubMed] [Google Scholar]
- 10.Gongora CA, Shibuya M, Wessler JD, McGregor J, Tellez A, Cheng Y, Conditt GB, Kaluza GL, Granada JF. Impact of paclitaxel dose on tissue pharmacokinetics and vascular healing: A comparative drug-coated balloon study in the familial hypercholesterolemic swine model of superficial femoral in-stent restenosis. JACC Cardiovasc Interv. 2015;8:1115–1123 [DOI] [PubMed] [Google Scholar]
- 11.Granada JF, Stenoien M, Buszman PP, Tellez A, Langanki D, Kaluza GL, Leon MB, Gray W, Jaff MR, Schwartz RS. Mechanisms of tissue uptake and retention of paclitaxel-coated balloons: Impact on neointimal proliferation and healing. Open heart. 2014;1:e000117. [DOI] [PMC free article] [PubMed] [Google Scholar]
- 12.Brodmann M, Werner M, Meyer DR, Reimer P, Kruger K, Granada JF, Jaff MR, Schroeder H, Investigators IER. Sustainable antirestenosis effect with a low-dose drug-coated balloon: The illumenate european randomized clinical trial 2-year results. JACC Cardiovasc Interv. 2018;11:2357–2364 [DOI] [PubMed] [Google Scholar]
- 13.Klein AJP, Feldman DN. The era of drug-coated balloons: Are all created equal? JACC Cardiovasc Interv. 2018;11:2365–2367 [DOI] [PubMed] [Google Scholar]
- 14.Lovich MA, Edelman ER. Tissue concentration of heparin, not administered dose, correlates with the biological response of injured arteries in vivo. Proc Natl Acad Sci U S A. 1999;96:11111–11116 [DOI] [PMC free article] [PubMed] [Google Scholar]
- 15.Hwang CW, Wu D, Edelman ER. Physiological transport forces govern drug distribution for stent-based delivery. Circulation. 2001;104:600–605 [DOI] [PubMed] [Google Scholar]
- 16.Tzafriri AR, Garcia-Polite F, Li X, Keating J, Balaguer JM, Zani B, Bailey L, Markham P, Kiorpes TC, Carlyle W, Edelman ER. Defining drug and target protein distributions after stent-based drug release: Durable versus deployable coatings. J Control Release. 2018;274:102–108 [DOI] [PMC free article] [PubMed] [Google Scholar]
- 17.Fanelli F, Cannavale A, Gazzetti M, Lucatelli P, Wlderk A, Cirelli C, d’Adamo A, Salvatori FM. Calcium burden assessment and impact on drug-eluting balloons in peripheral arterial disease. Cardiovasc Intervent Radiol. 2014;37:898–907 [DOI] [PubMed] [Google Scholar]
- 18.Tzafriri AR, Parikh SA, Edelman ER. Taking paclitaxel coated balloons to a higher level: Predicting coating dissolution kinetics, tissue retention and dosing dynamics. J Control Release. 2019;310:94–102 [DOI] [PMC free article] [PubMed] [Google Scholar]
- 19.Speck U, Cremers B, Kelsch B, Biedermann M, Clever YP, Schaffner S, Mahnkopf D, Hanisch U, Bohm M, Scheller B. Do pharmacokinetics explain persistent restenosis inhibition by a single dose of paclitaxel? Circ Cardiovasc Interv. 2012;5:392–400 [DOI] [PubMed] [Google Scholar]
- 20.Kolachalama VB, Pacetti SD, Franses JW, Stankus JJ, Zhao HQ, Shazly T, Nikanorov A, Schwartz LB, Tzafriri AR, Edelman ER. Mechanisms of tissue uptake and retention in zotarolimus-coated balloon therapy. Circulation. 2013 [DOI] [PMC free article] [PubMed] [Google Scholar]
- 21.Li Y, Tellez A, Rousselle SD, Dillon KN, Garza JA, Barry C, Granada JF. Biological effect on drug distribution and vascular healing via paclitaxel-coated balloon technology in drug eluting stent restenosis swine model. Catheter Cardiovasc Interv. 2016;88:89–98 [DOI] [PMC free article] [PubMed] [Google Scholar]
- 22.Speck U, Hackel A, Schellenberger E, Kamann S, Lochel M, Clever YP, Peters D, Scheller B, Trog S, Bettink S. Drug distribution and basic pharmacology of paclitaxel/resveratrol-coated balloon catheters. Cardiovasc Intervent Radiol. 2018;41:1599–1610 [DOI] [PMC free article] [PubMed] [Google Scholar]
- 23.Schindelin J, Arganda-Carreras I, Frise E, Kaynig V, Longair M, Pietzsch T, Preibisch S, Rueden C, Saalfeld S, Schmid B, Tinevez JY, White DJ, Hartenstein V, Eliceiri K, Tomancak P, Cardona A. Fiji: An open-source platform for biological-image analysis. Nature methods. 2012;9:676–682 [DOI] [PMC free article] [PubMed] [Google Scholar]
- 24.Shukla VV, Padole PM, Deshpande S, Mardikar HM. Assessment of vascular injury during stent placement using contact mechanics International Journal for Computational Vision and Biomechanics, V. 2010;3:157–165 [Google Scholar]
- 25.Chang GH, Azar DA, Lyle C, Chitalia VC, Shazly T, Kolachalama VB. Intrinsic coating morphology modulates acute drug transfer in drug-coated balloon therapy. Sci Rep. 2019;9:6839. [DOI] [PMC free article] [PubMed] [Google Scholar]
- 26.Long J, Ding Y, Yuan W, Chen W, Wang G. General relations of indentations on solids with surface tension. Journal of Applied Mechanics,. 2017;84 [Google Scholar]
- 27.Wang QJ, Zhu D. Hertz theory: Contact of cylindrical surfaces In: Wang QJ, Chung Y-W, eds. Encyclopedia of tribology. Boston, MA: Springer US; 2013:1639–1647. [Google Scholar]
- 28.Danpinid A, Terdtoon P, Sakulchangsatjatai P, Vappou J, Konofagou EE. Stress--strain analysis of a longitudinal heterogeneous arterial wall In: Öchsner A, da Silva LFM, Altenbach H, eds. Analysis and design of biological materials and structures. Berlin Heidelberg: Springer; 2012:19–32. [Google Scholar]
- 29.Granada JF, Virmani R, Schulz-Jander D, Tunev S, Melder RJ. Rate of drug coating dissolution determines in-tissue drug retention and durability of biological efficacy. Journal of drug delivery. 2019;2019:9560592. [DOI] [PMC free article] [PubMed] [Google Scholar]
- 30.Ebenstein DM, Coughlin D, Chapman J, Li C, Pruitt LA. Nanomechanical properties of calcification, fibrous tissue, and hematoma from atherosclerotic plaques. J Biomed Mater Res A. 2009;91:1028–1037 [DOI] [PubMed] [Google Scholar]
- 31.Hamilton AJ, Kim H, Nagaraj A, Mun JH, Yan LL, Roth SI, McPherson DD, Chandran KB. Regional material property alterations in porcine femoral arteries with atheroma development. J Biomech. 2005;38:2354–2364 [DOI] [PubMed] [Google Scholar]
- 32.Fernandez-Parra R, Laborda A, Lahuerta C, Lostale F, Aramayona J, de Blas I, de Gregorio MA. Pharmacokinetic study of paclitaxel concentration after drug-eluting balloon angioplasty in the iliac artery of healthy and atherosclerotic rabbit models. J Vasc Interv Radiol. 2015;26:1380–1387 e1381 [DOI] [PubMed] [Google Scholar]
- 33.Stolzenburg N, Breinl J, Bienek S, Jaguszewski M, Lochel M, Taupitz M, Speck U, Wagner S, Schnorr J. Paclitaxel-coated balloons: Investigation of drug transfer in healthy and atherosclerotic arteries - first experimental results in rabbits at low inflation pressure. Cardiovascular drugs and therapy. 2016;30:263–270 [DOI] [PMC free article] [PubMed] [Google Scholar]
- 34.Delrio FW, de Boer MP, Knapp JA, David Reedy E Jr., Clews PJ, Dunn ML. The role of van der waals forces in adhesion of micromachined surfaces. Nat Mater. 2005;4:629–634 [DOI] [PubMed] [Google Scholar]
- 35.Katsanos K More evidence and more questions about paclitaxel-coated balloons in the femoropopliteal segment. JACC Cardiovasc Interv. 2018;11:942–944 [DOI] [PubMed] [Google Scholar]
- 36.Rocha-Singh KJ, Duval S, Jaff MR, Schneider PA, Ansel GM, Lyden SP, Mullin CM, Ioannidis JPA, Misra S, Tzafriri AR, Edelman ER, Granada JF, White CJ, Beckman JA, Viva Physicians I. Mortality and paclitaxel-coated devices: An individual patient data meta-analysis. Circulation. 2020;141:1859–1869 [DOI] [PMC free article] [PubMed] [Google Scholar]
- 37.Schneider PA, Laird JR, Doros G, Gao Q, Ansel G, Brodmann M, Micari A, Shishehbor MH, Tepe G, Zeller T. Mortality not correlated with paclitaxel exposure: An independent patient-level meta-analysis of a drug-coated balloon. J Am Coll Cardiol. 2019;73:2550–2563 [DOI] [PubMed] [Google Scholar]
- 38.Secemsky EA, Kundi H, Weinberg I, Jaff MR, Krawisz A, Parikh SA, Beckman JA, Mustapha J, Rosenfield K, Yeh RW. Association of survival with femoropopliteal artery revascularization with drug-coated devices. JAMA cardiology. 2019;4:332–340 [DOI] [PMC free article] [PubMed] [Google Scholar]
- 39.Scheller B, Vukadinovic D, Jeger R, Rissanen TT, Scholz SS, Byrne R, Kleber FX, Latib A, Clever YP, Ewen S, Bohm M, Yang Y, Lansky A, Mahfoud F. Survival after coronary revascularization with paclitaxel-coated balloons. J Am Coll Cardiol. 2020;75:1017–1028 [DOI] [PubMed] [Google Scholar]
- 40.Kolodgie FD, Pacheco E, Yahagi K, Mori H, Ladich E, Virmani R. Comparison of particulate embolization after femoral artery treatment with in.Pact admiral versus lutonix 035 paclitaxel-coated balloons in healthy swine. J Vasc Interv Radiol. 2016;27:1676–1685 e1672 [DOI] [PubMed] [Google Scholar]
- 41.Lee K, Lee SG, Jang I, Park SH, Yang D, Seo IH, Bong SK, An DH, Lee MK, Jung IK, Jang YH, Kim JS, Ryu W. Linear micro-patterned drug eluting balloon (lmdeb) for enhanced endovascular drug delivery. Sci Rep. 2018;8:3666. [DOI] [PMC free article] [PubMed] [Google Scholar]
Associated Data
This section collects any data citations, data availability statements, or supplementary materials included in this article.


