
Figure 2.
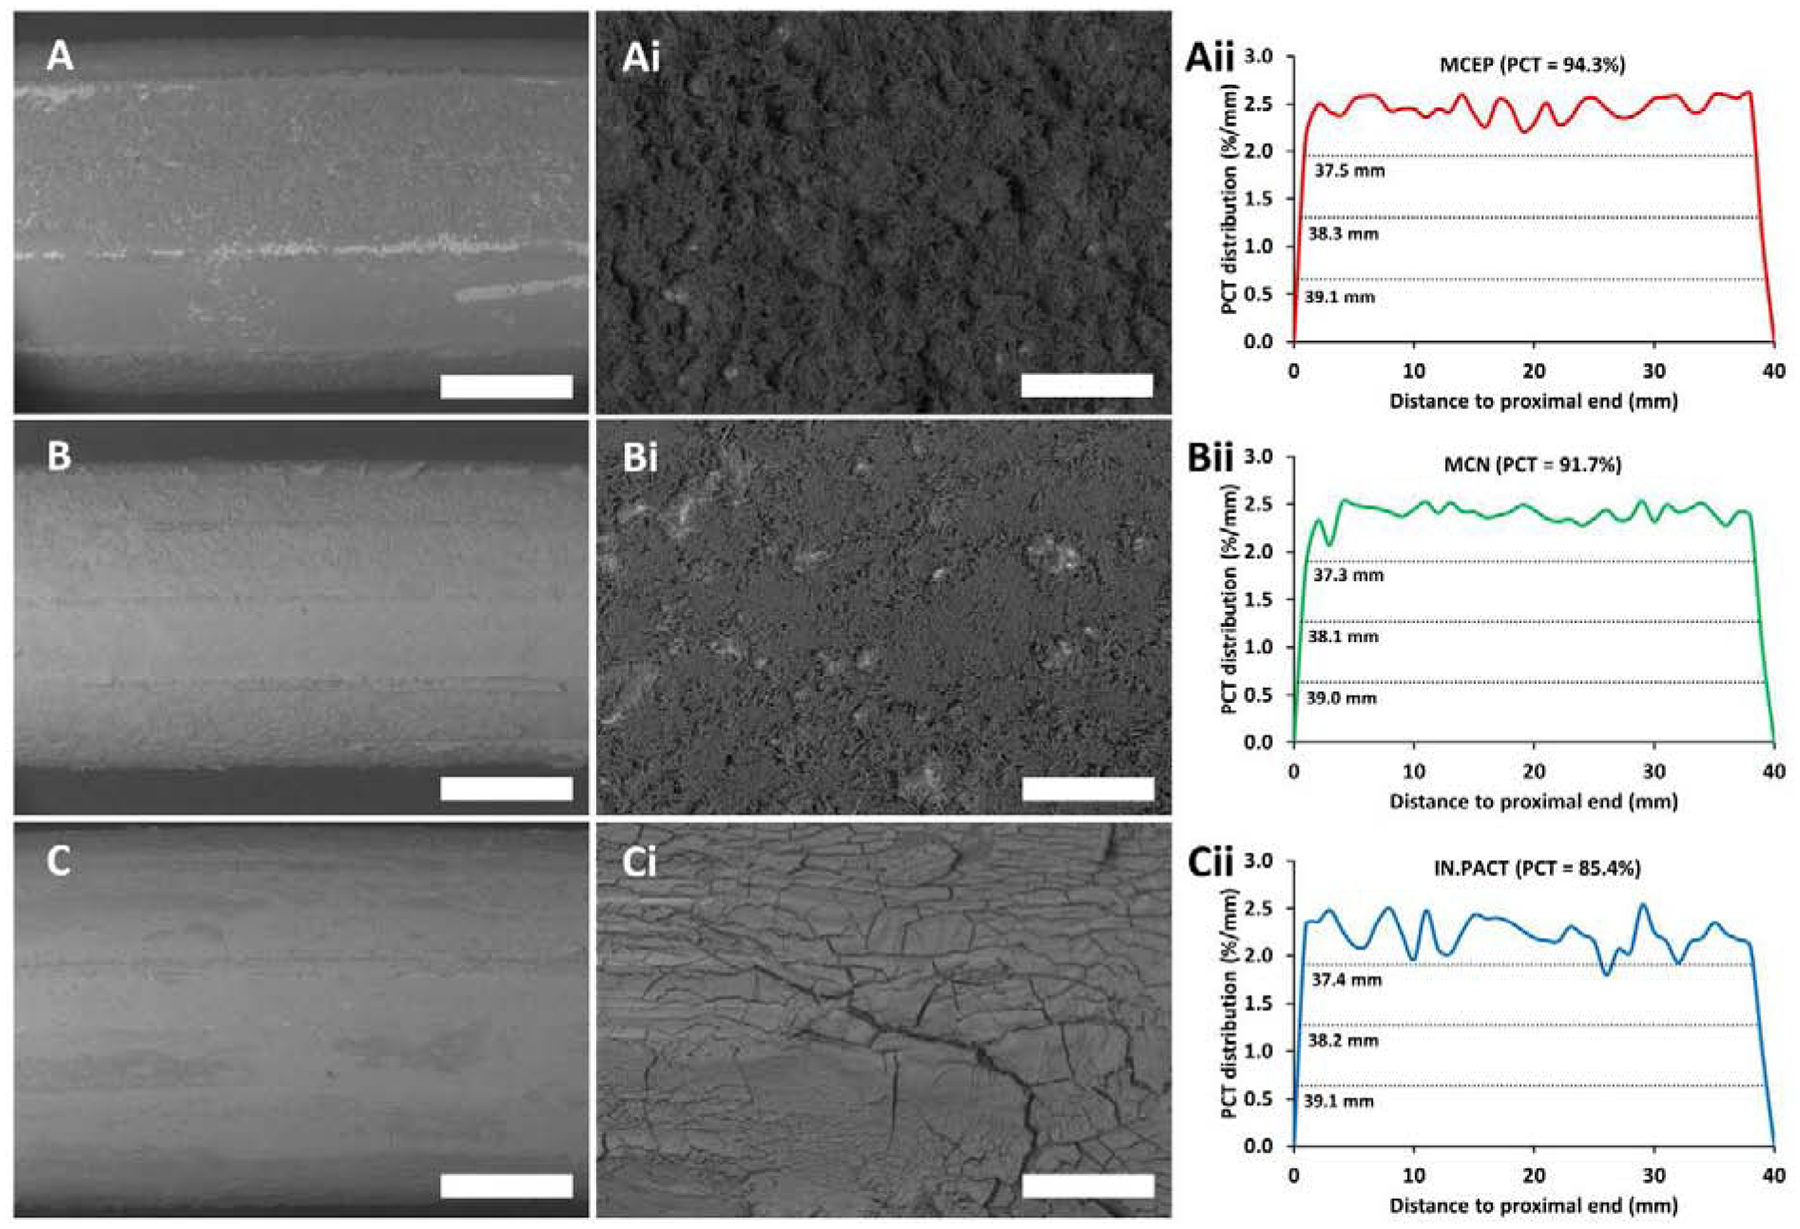
Coating distributions and micro-morphologies of air inflated PCBs. (A-C) Representative low magnification (15×) SEM images of mid-portions of MCEP (A), MCN (B) and IN.PACT (C), displaying gross coating distributions and morphologies (montages of the entire PCBs are depicted in Supplemental Figure 4 A–C). (Ai-Ci) High magnification (150×) resolution of coating micromorphologies in A-C. (Aii-Cii) Longitudinal coating distributions for MCEP (Aii), MCN (Bii) and IN.PACT (Cii) along the entire length of the same PCBs. Scale bar = 2 mm (A-C) / 200 μm (Ai-Ci).