
Figure 3.
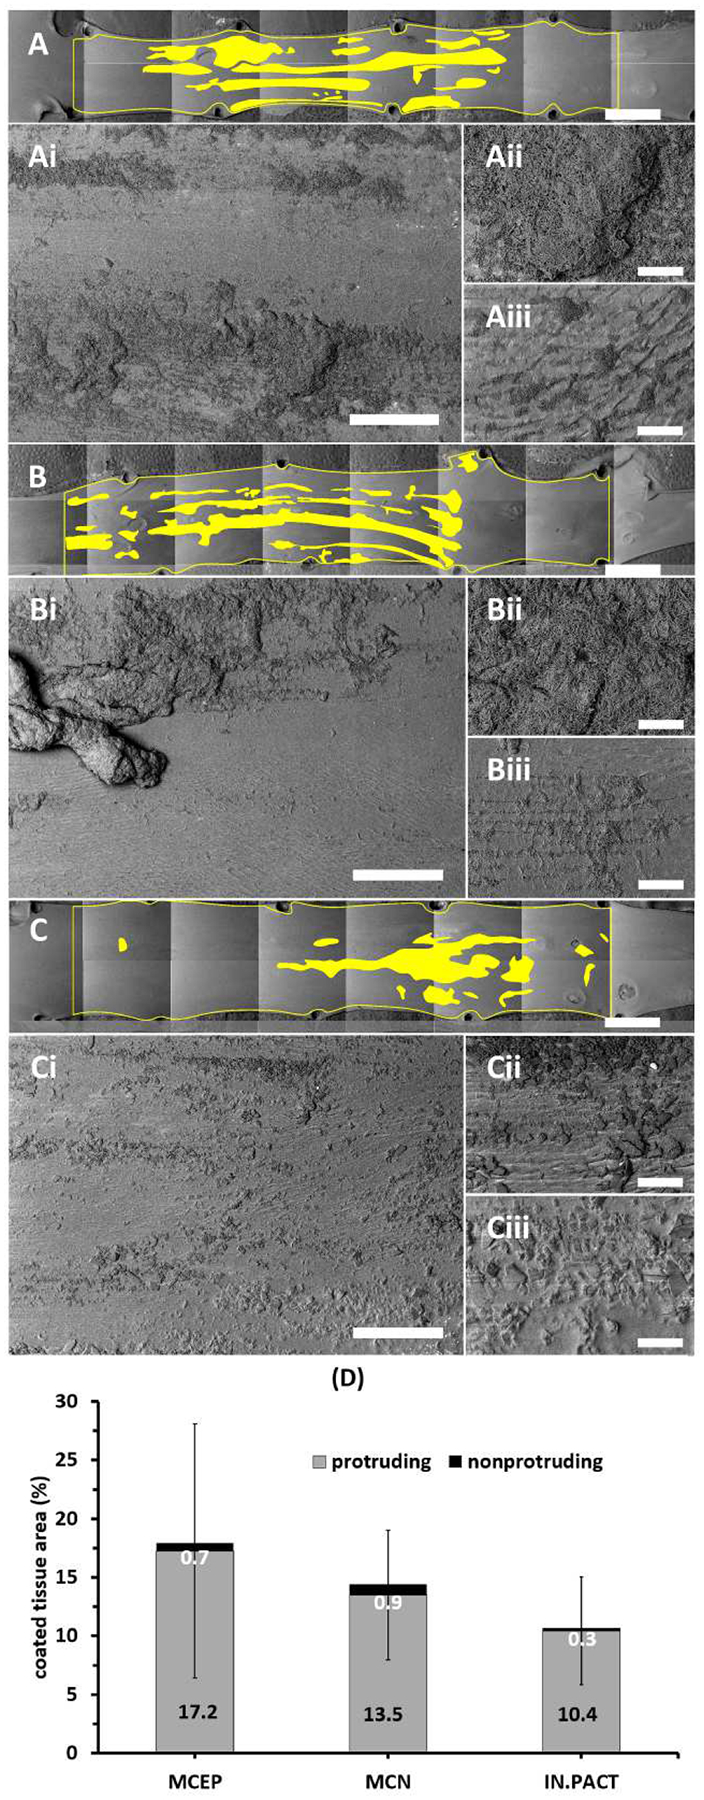
Surprisingly sparse coating distributions 0.5h post treatment. (A-C) Representative montaged 20× images of treated areas with coated areas highlighted by yellow masking post-treatment with MCEP (A), MCN (B) or IN.PACT (C). (Ai-Ci) All three PCBs transferred coating in clearly visible patches. At 50×, coating appeared to be predominantly surface protruding (Aii-Cii), though clusters of microneedles were visible in surface crevices (Aii-Bii) and some of the amorphous coating flakes were partially or fully embedded into the tissue surface (Ciii). Scale bar = 4 mm (A-C) / 500 μm (Ai-Ci) / 100 μm (Aii-Cii and Aiii-Ciii). (D) Device averaged PCT are dominated by protruding coating (values in black text). Enlarged versions of the high magnification images depicted in panels Aii-Cii and Aiii-Ciii are provided in Supplemental Figure 4.