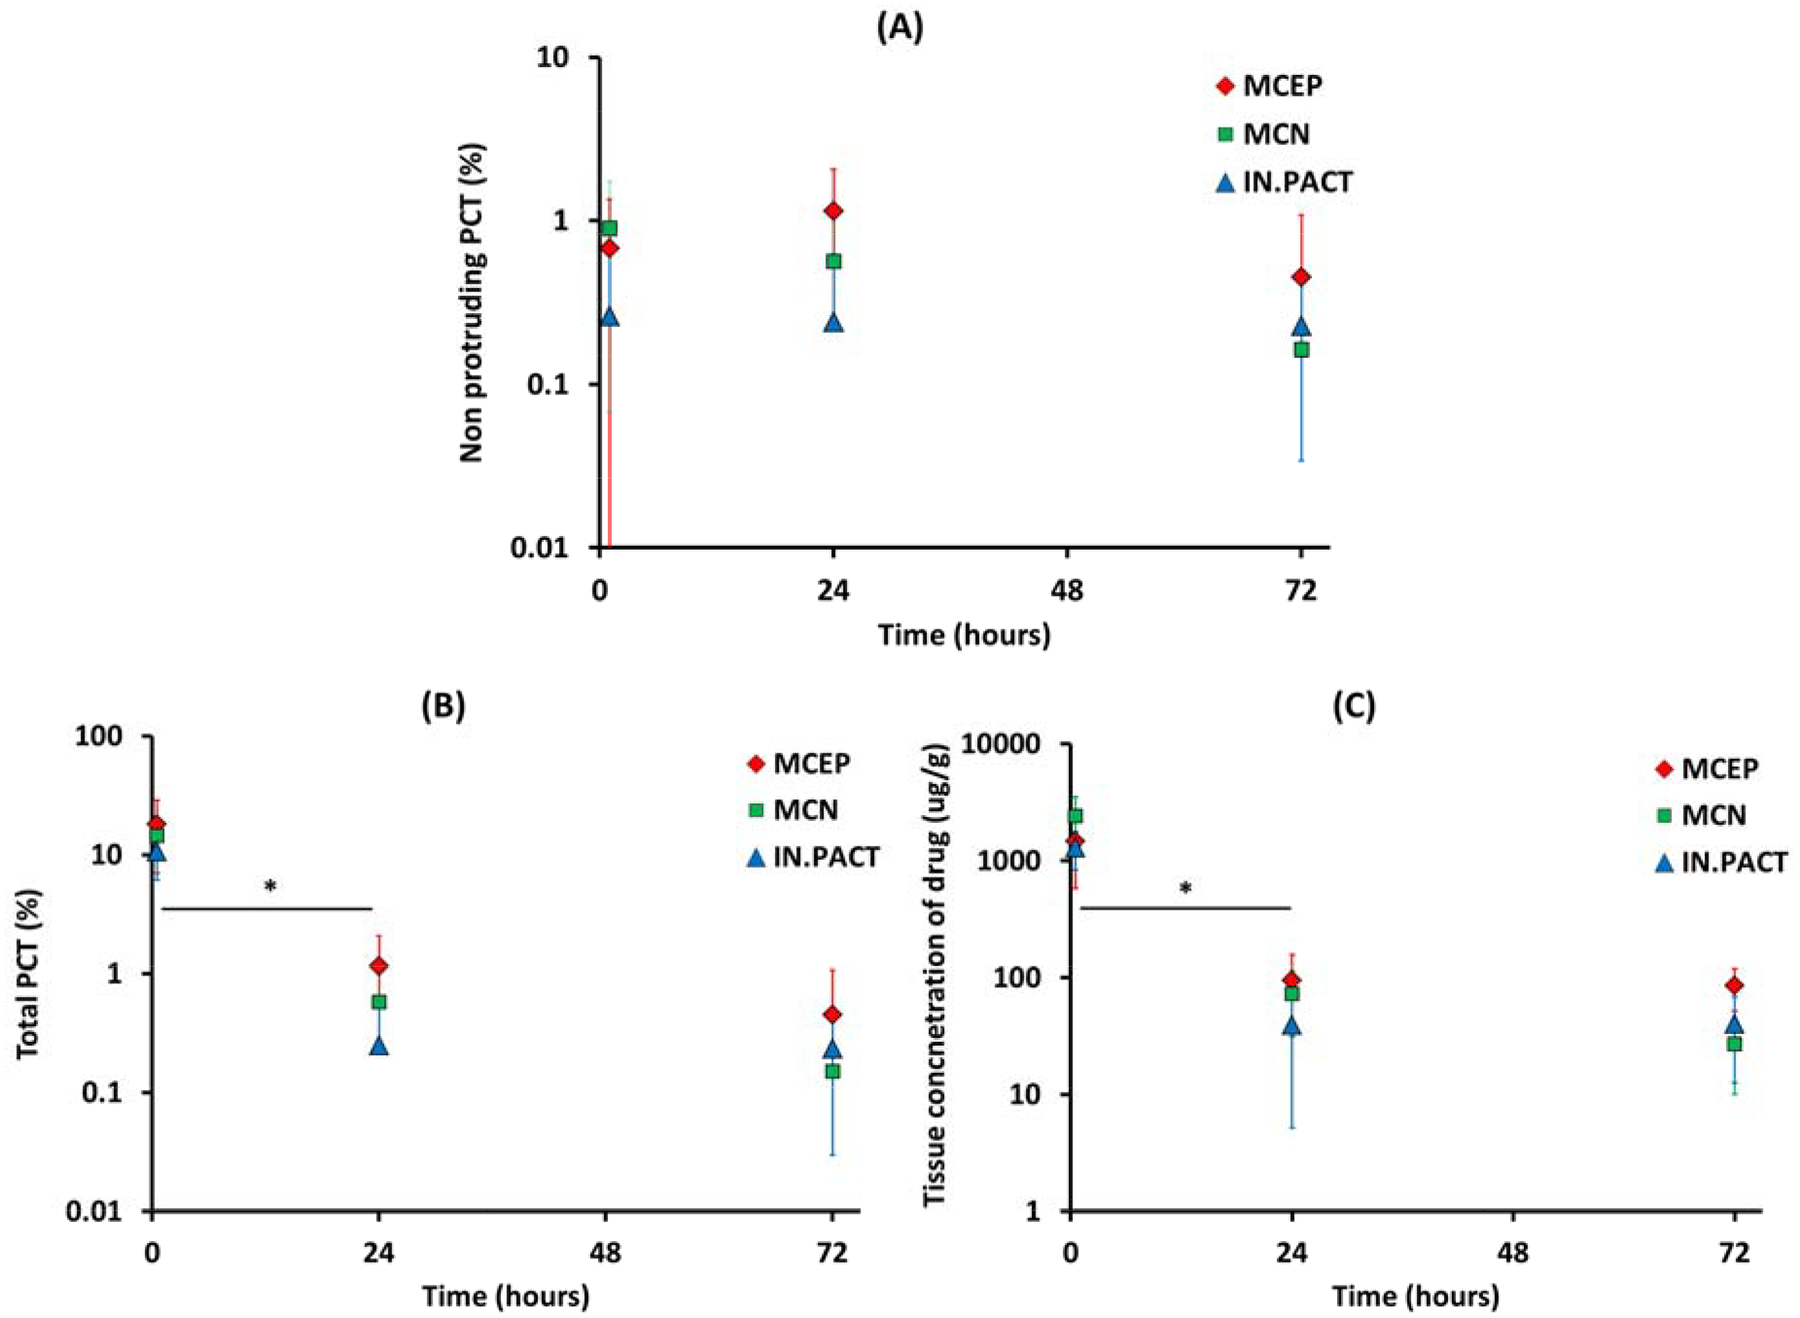
Figure 8.

Kinetics of PCT and drug concentration. Non protruding PCT levels vary slowly between 0.5 and 72h (A), whereas the total PCT (B) and the concentration of paclitaxel in the tissue (C) both exhibit a statistically significant (*) early decline after MCEP (red), MCN (green) and IN.PACT (blue) treatments.
