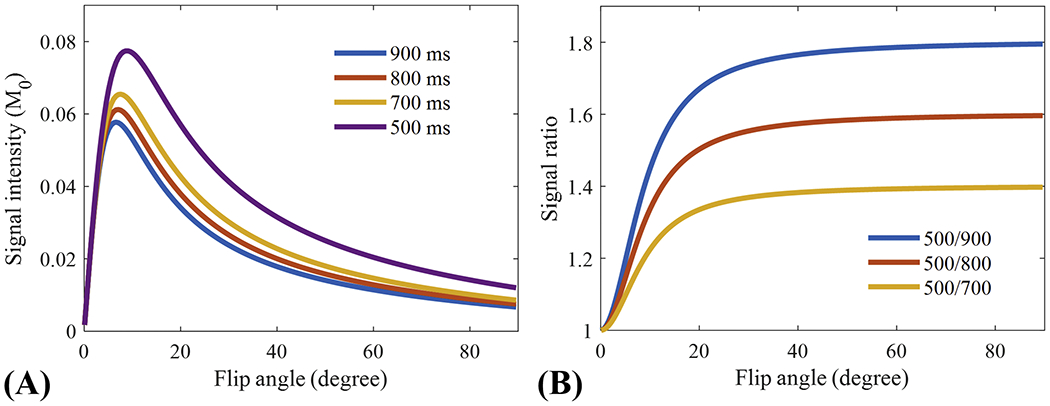
Figure 2.

Numerical simulation results of the signal intensities of different T1 tissues (i.e., 500, 700, 800, and 900 ms) (A) and corresponding signal ratios between the tissue with a T1 of 500 ms and the three remaining tissues (B). Signal intensities of all T1s first increase then decrease with higher flip angles (A), while all the signal ratios continue to increase with higher flip angle (B). A higher signal ratio is achieved as the difference in T1 between the two utilized tissues increases.
