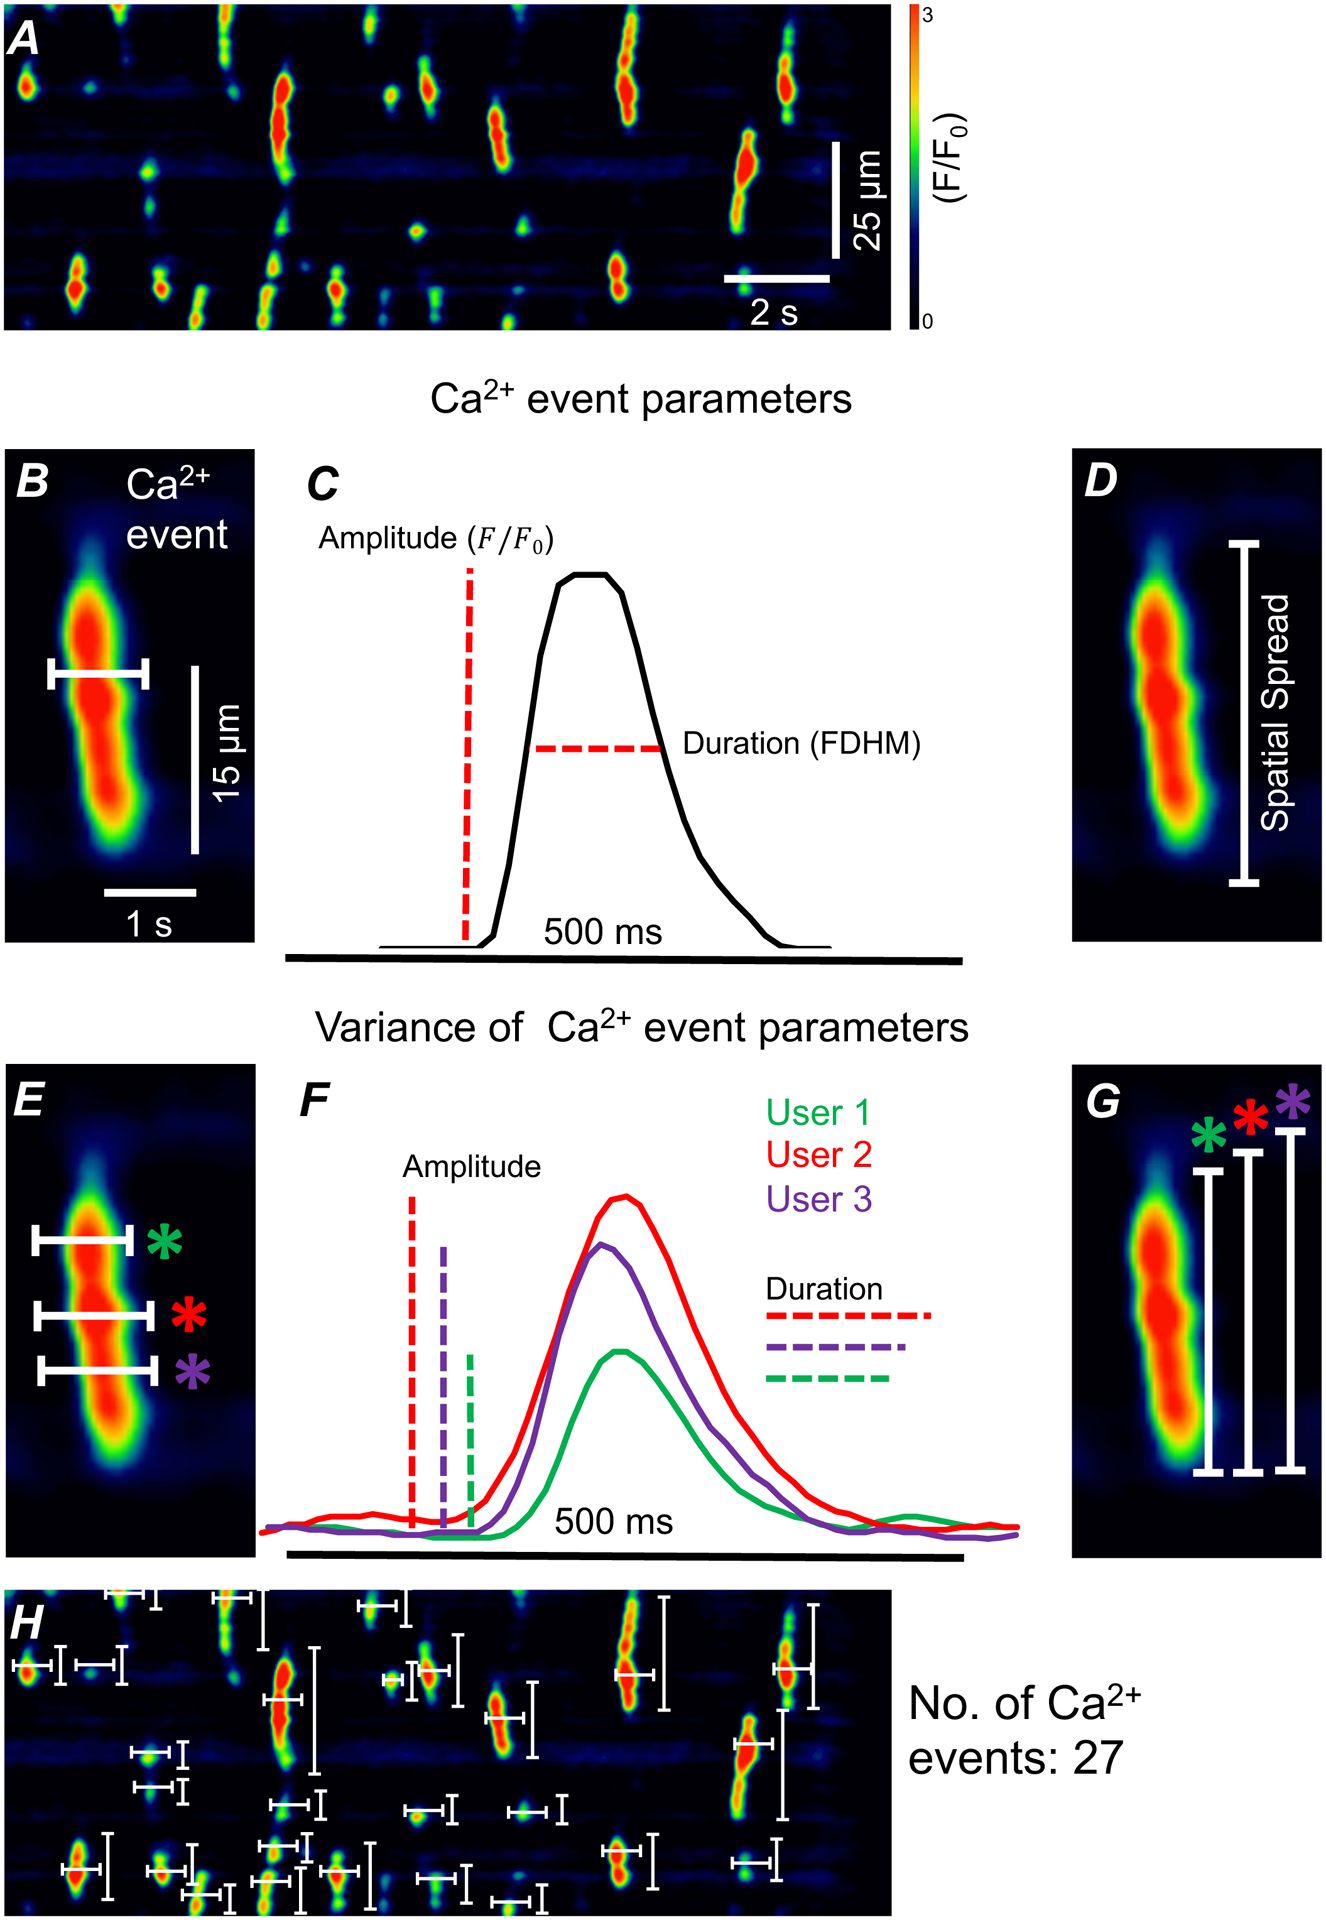
Figure 2: Analysis of Ca2+ events in ICC-DMP using STMaps.

A) Representative STMap of Ca2+ transients in ICC-DMP. B) Enlarged single Ca2+ event from panel A. Representative single pixel-line drawn (white) through Ca2+ event in Fiji.. Line is drawn parallel to time (x-axis) C) Plot profile generated from single pixel-line from panel B. Amplitude and event duration (full duration of half maximum) are measured from plot profile. D) Enlarged single Ca2+ event from panel A with representative measurement of Ca2+ event spatial spread (white). E) Single pixel-lines (white) drawn by three users across Ca2+ event. Users 1,2, and 3 are indicated by green, red, and purple respectively. F) Plot profile generated by the three user defined pixel-lines from panel E. Variation is present in both amplitude and event duration. G) Variable spatial spread present in three user defined single pixel-line measurements (white) of single Ca2+ event. H) 54 single pixel-lines (white) required to analyze event duration, spatial spread, and amplitude of 27 Ca2+ events from ICC-DMP STMap. Scale bars in panel A and panel B apply to panels H and D, E, G respectively.
