
Figure 9: High-throughput extraction of Ca2+ dynamic parameters from ICC-DMP STMaps.
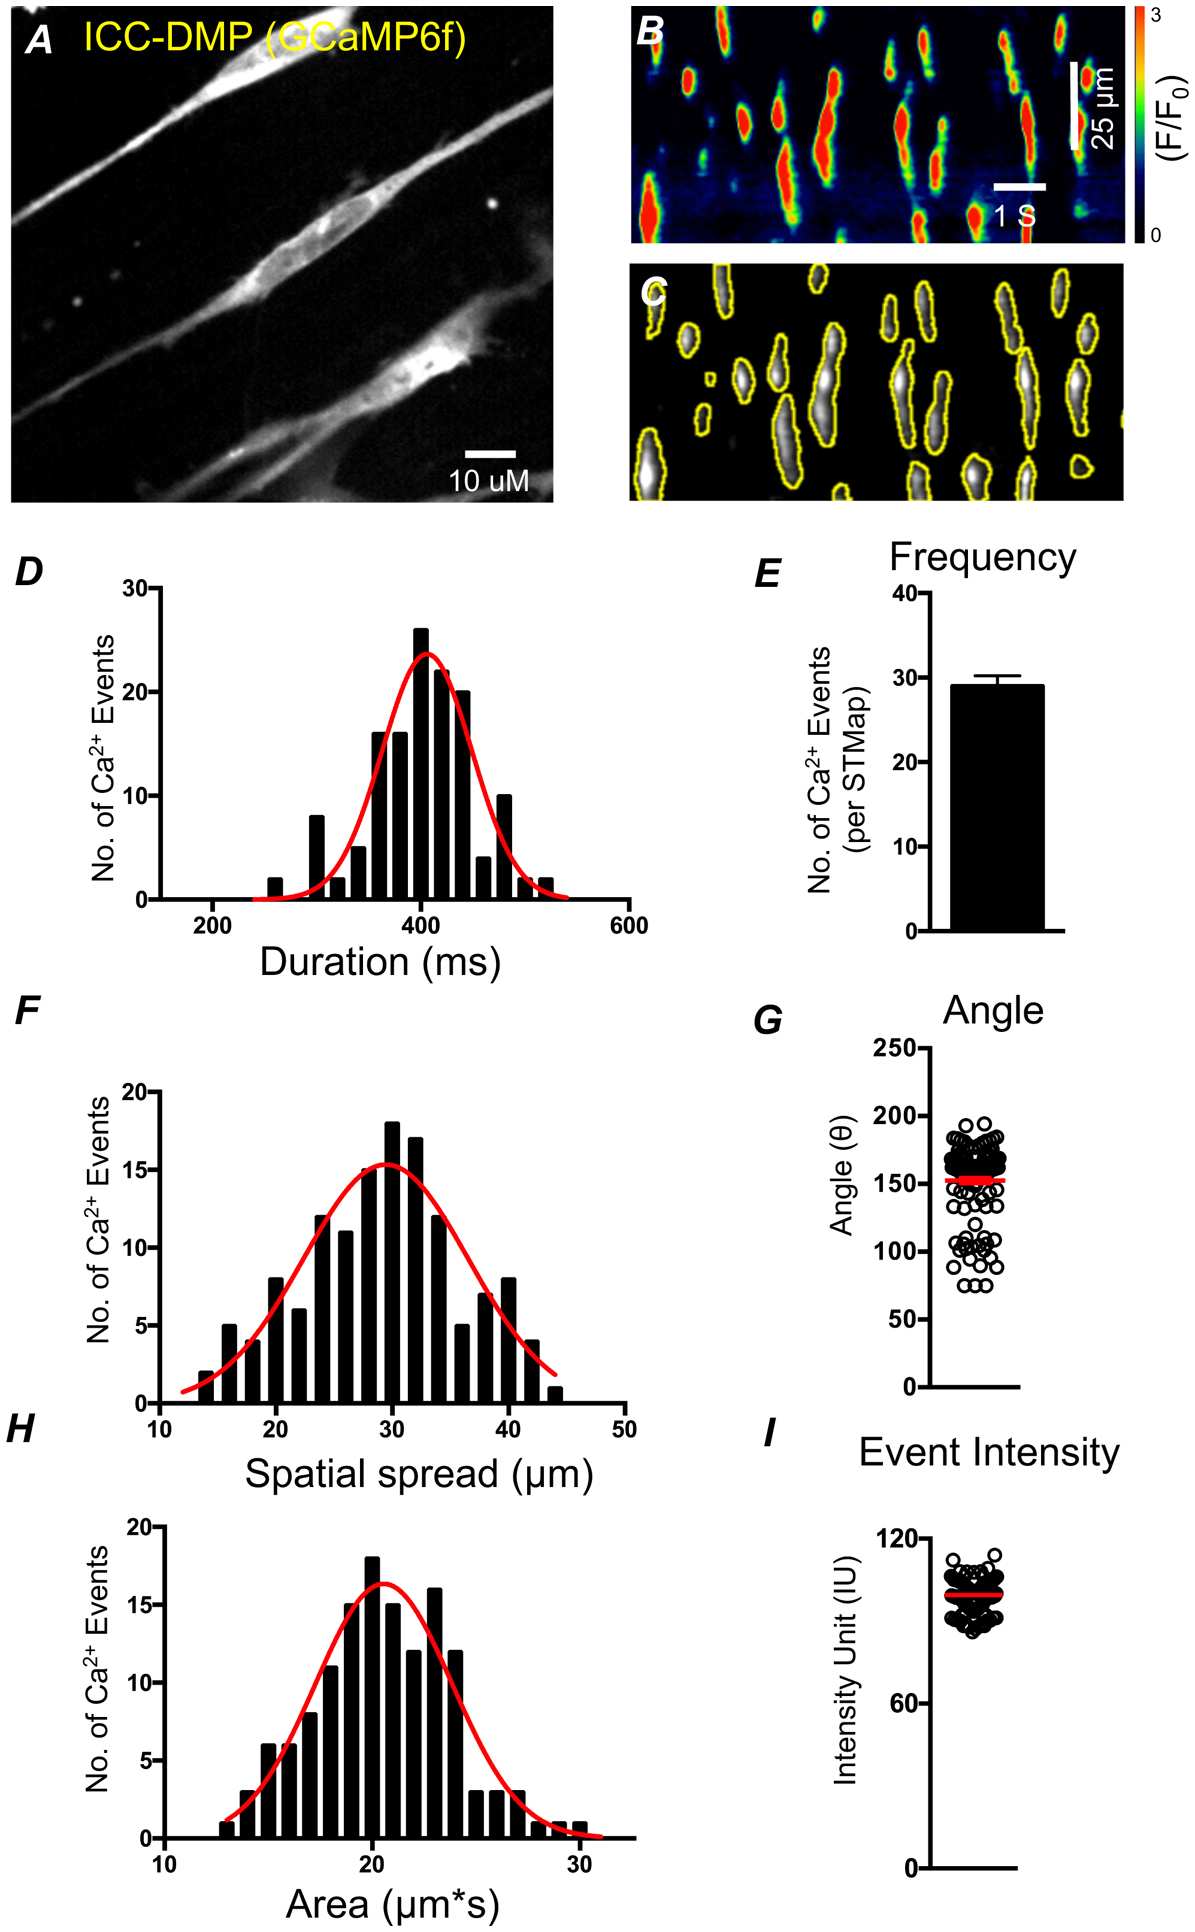
A) Representative image of ICC-DMP from the small intestine of a Kit-Cre-GCaMP6 mouse B) STMap of Ca2+ events generated from panel A. Scale bars in panel B also apply to panel C. C) Plugin generated ROIs (yellow) overlaid on greyscale STM. D,F,H) Plugin generated data of Ca2+ event parameters represented by summary histogram (black) fitted with a gaussian distribution (red) showing Ca2+ event duration, spatial spread, and area respectively. E,G,I) Plugin generated data of Ca2+ event parameters: event frequency per STMap, angle, event intensity from ICC-DMP STMaps respectively. (All Ca2+ STMaps analyzed were 30 s recordings, n=5).