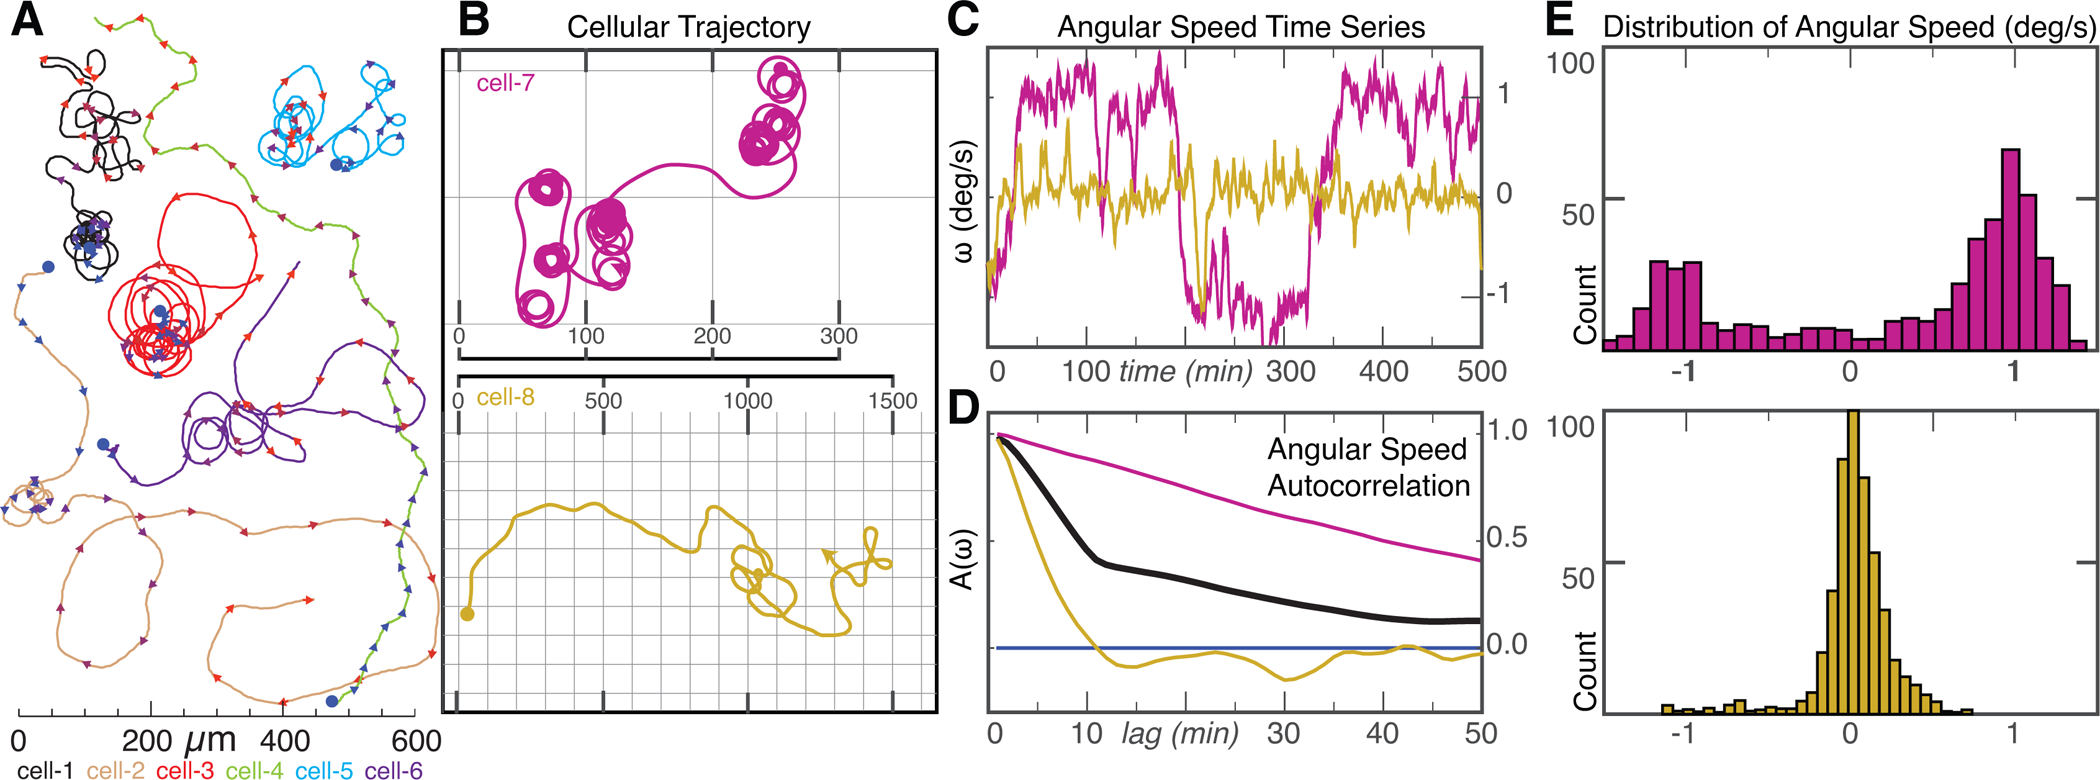
Figure 1. Long-term trajectories of single cells exhibit persistent turning states.

(A) Example trajectories of 6 keratocytes cells over a time scale of ~10 hours. Trajectories start at blue dots, and each color represents a different cell. Arrowheads indicate the current direction of motion every 20 minutes and are colored from blue/start to red/finish. Scale bar indicates distance traveled. Note cells can exhibit two phases of migration with long periods of persistent turning intermixed with periods of straighter paths.
(B) Example trajectory of a cell exhibiting prolonged periods of persistent turning (cell-7, magenta, top) and a cell following a wandering path (cell-8, gold, bottom). Scale in micrometers.
(C) Time series of angular velocity, (ω), for cell-7 (magenta) and cell-8 (gold).
(D) Auto-correlation of angular velocity (A(ω)) as a function of lag time in minutes for cell-7 (magenta), cell-8 (gold) and average of all 38 cells (black).
(E) Distribution of angular velocities for the persistently turning cell-7 (magenta, top) and the wandering cell-8 (gold, bottom).
